How to use Ferret graticule qualifiers /GRATICULE /HGRATICULE /VGRATICULE
Below is an annotated version of the script graticules_demo.jnl
The /GRATICULE, /HGRATICULE and /VGRATICULE qualifiers for plot commands turn on and control the line type for graticule lines at the tic marks of the axes.
/GRATICULE sets the horizontal and vertical tic marks to be the same style. The lines may take on the same characteristics as lines that we plot with the Ferret PLOT command: dashed or solid; colors Black,Red,Green,Blue,LightBlue,Purple, and White and THICK=1,2, or 3 where 1 is thin and 3 is the thickest.
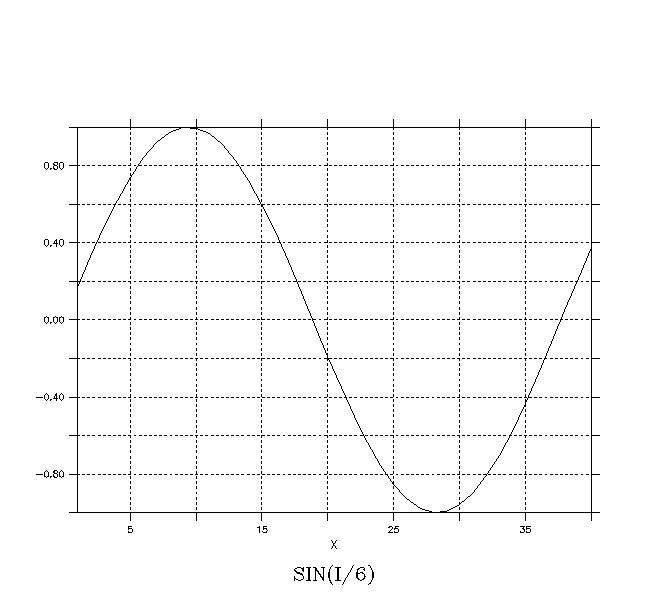
yes? PLOT/GRAT=dash/i=1:40 sin(i/6)
We can give multiple arguments to the /GRATICULE qualifier within parentheses
    yes? USE coads_climatology
    yes? SET REGION/X=130E:70W/y=30S:50N/L=1
    yes? CONTOUR/COLOR=blue/GRAT=(line,COLOR=red) sst
	yes? GO land thick

Here is another example of a simple /GRAT qualifier
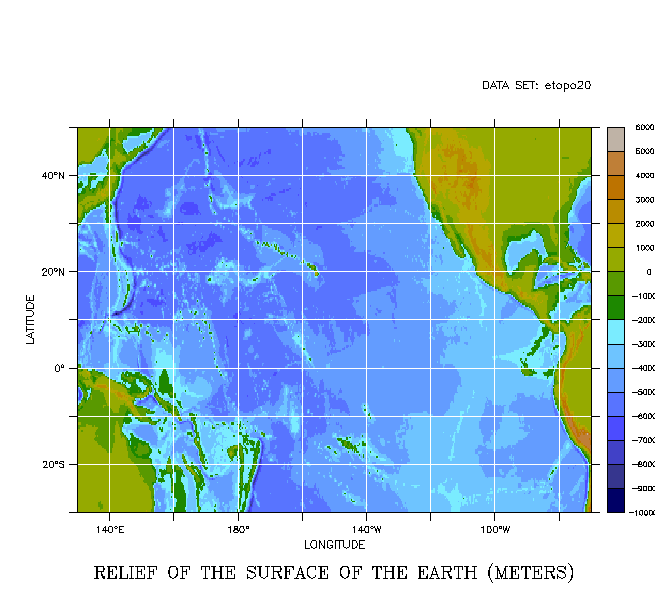
    yes? USE etopo20
    yes? SHADE/PAL=dark_land_sea/GRAT=(COLOR=white) rose
Also a time axis.
    yes? DEFINE AXIS/t=1-jan-1990:1-jan-2002:1/units=days tax
    yes? LET tt = t[gt=tax]; LET my_data = sin(tt/100)* tt/100
    yes? PLOT/THICK=3/GRAT=(COLOR=BLUE,THICK)/t=1-jan-1990:1-jan-2002 my_data; pause

If there are large and small tics on the plot, each may have graticule lines with different characteristics. Recall that time axes and log axes automatically have small tic marks; you can control the tic marks on other axes using the commands listed under "axis, customizing" and "axis, PPLUS commands" in the Ferret Users Guide.
    yes? ppl axnmtc,2,2
    yes? PLOT/GRAT="large=(line),small=(dash)"/i=1:40 sin(i/6)

Sometimes we might want to make different settings for the horizontal and vertical graticules; when the two axes represent different quantities, such as space and time, or very different scales. The /HGRATICULE qualifier sets the horizontal graticules and the /VGRATICULE qualifier sets the vertical graticules.
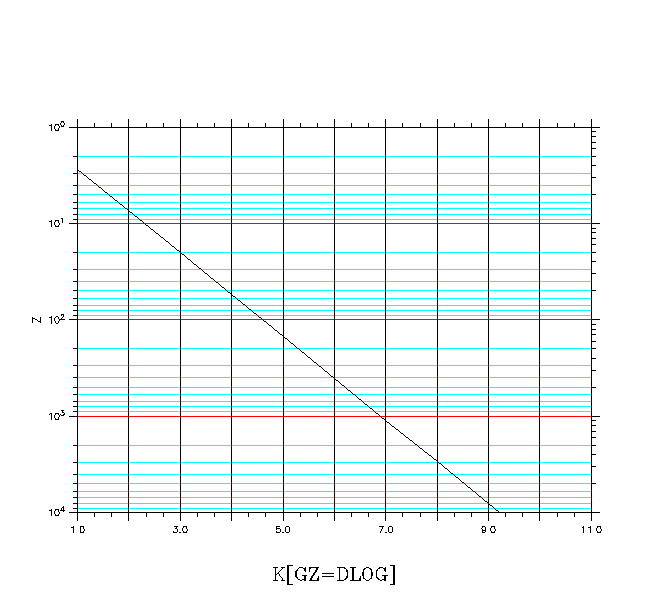
Here is a plot with a logarithmic axis
    yes? DEF AXIS/Z/DEPTH dlog=exp(k[k=1:10])
    yes? LET fcn = k[gz=dlog]
    yes? PLOT/VLOG/VLIMITS=1:10000/HGRAT="LARGE(COLOR=red),SMALL(COLOR=lightblue)"/VGRAT fcn
And, a time axis, with only the vertical graticules on.
    yes? USE monthly_navy_winds
    yes? SET REGION/X=180/Y=0/T=1-may-1989:1-may-1992
    yes? PLOT/VGRAT="LARGE(line,COLOR=blue),SMALL(line,COLOR=lightblue)" uwnd

Here we set the axis tics with PPL commands and do a shade plot
    yes? USE coads_climatology
    yes? SET REGION/X=130E:70W/y=30S:50N/L=1
    yes? SHADE/SET/HGRAT="LARGE=(THICK),SMALL=(dash)"/VGRAT="LARGE=(THICK),SMALL=line" sst
    yes? PPL XAXIS 130e,70w,15
    yes? PPL YAXIS -30,50,15
    yes? PPL SHADE
    yes? GO fland 20

Note that the land fill overplots the graticule lines. We can work around this by overlaying an empty plot with the original graticule qualifiers.
    yes? LET baddat = `sst,RETURN=bad` + 0*sst
    yes? SHADE/OVER/NOLAB/HGRAT="LARGE=(THICK),SMALL=(dash)"/VGRAT="LARGE=(THICK),SMALL=line" baddat; pause

oar.pmel.contact_ferret@noaa.gov
18 Mar, 2004