Ref Sec23.
/I/J/K/L/M/N /X/Y/Z/T/E/F /ALONG /OVERLAY/ SET_UP /FRAME /D/ TRANPOSE/ VS/ SYMBOL/ NOLABEL /LINE /COLOR /THICKNES /SIZE /HLIMITS /VLIMITS /TITLE /STEP /NOAXES /DASH /HGRATICULE /VGRATICULE /HLOG /VLOG /GRATICULE /NOKEY /NOYADJUST /KEY /RIBBON /LEVELS /PALETTE /FAST /MISSING /GAPLOC /SKIPSYM /DEGMINSEC /HALFSPACE /HIGHLIGHT
Produces a line plot. For Discrete Sampling Geometries (DSG) data the line plot type is customized to the feature type.
yes? PLOT[/qualifiers] [expression_1 , expression_2 , ...]
The indicated expression(s) must represent a line (not a plane) of data (PLOT/VS is an exception). Unless the /VS qualifier is used, the independent variable is the underlying coordinate axis for this line of data.
Example:
yes? PLOT/l=1:100 sst
produces a time series plot of the first 100 points of sst.
Parameters
The argument(s) for PLOT specify the variable or expression to be plotted.
When the /VS qualifier is used the indicated expressions may have any geometry in 4D space but they must match in the total number of points in each expression. The points are associated in the order of their underlying axes. When the /VS qualifier is not used, the indicated expression(s) must describe a line (not a plane) of data.
The expression(s) are inferred from the current context if omitted from the command line—i.e., if no expression is given then the argument most recently given is used, or the default expression may be explicitly set with SET EXPRESSION.
When Ferret plots multiple data lines simultaneously, PPLUS automatically cycles through pen colors and symbols, creating up to 26 distinct line types. Try GO line_samples to see samples of these styles:
Command qualifiers for PLOT:
PLOT/I=/J=/K=/L=/M=/N=/X=/Y=/Z=/T=/E=/F=
Specifies value or range of axis subscripts (I, J, K, L, M, or N), or axis coordinates (X, Y, Z, T, E, or F) to be used when evaluating the expression(s) being plotted.
Specifies the default data set to be used when evaluating the expression(s) being plotted.
PLOT/ALONG= X, Y, Z, T, E, F
Makes a set of line plots from a multi- dimensional variable. The command operates by making a set of variables internally which are single dimensional in the direction given. It uses the automatically-generated line styles for a multiple-line plot (first running through available colors, then adding symbols to the line.) It also draws the automatically-generated line key.
For DIscrete Sampling Geometries (DSG) data variables, PLOT/ALONG= changes the plot type, e.g. for profile data, plot/along=xy makes a longitude-latitude map plot showing data at the profile stations. See the section about DSG data for more details.
A maximum of 40 different lines are drawn using this style. If the grid of the variable being plotted has more lines in the given direction, the command will decimate the variable to yield 40 lines.
Examples:
yes? PLOT/ALONG=z/y=0 SALT[x=170:220]

yes? use coads_climatology
yes? PLOT/ALONG=t/x=330 sst
           *** NOTE: Decimating PLOT/ALONG lines to /KEY limit of 40
Some useful commands in combination with PLOT/ALONG:
- The /LINE qualifier: PLOT/ALONG=/LINE draws lines only, no symbols. the set of lines is drawn first with all of the colors and a thin line, then switching to thicker lines/.
- MODE LINECOLOR: Use MODE LINECOLOR to define a larger number of colors than the initial set. Then PLOT/ALONG will use all of the colors before starting to repeat with other line styles and the same increased set of colors.
- The /SKIPSYM qualifier: PLOT/ALONG= /SKIPSYM= decimates the symbols along the lines to clean up the image.
- The /NOKEY qualifier: PLOT/ALONG= /NOKEY removes the key and labels below the plot. When there are many lines, the individual labels and line examples may not be as useful as a general descriptive title, e.g. PLOT/ALONG=t/NOKEY/TITLE="Annual cycle in the range -40:40 longitude" my_var
Causes the graphic image produced to be captured as an animation frame and written to the movie file specified by SET MOVIE. In general the FRAME command is more flexible and we recommend its use rather than this qualifier. (note that HDF movies are discontinued with Ferret V6.6).
Simple syntax for line plots. For line plots it is possible with these qualifiers to control line thickness and color with commands such as
yes? PLOT/COLOR=blue/THICK=2 I[i=1:3]
This is equivalent to the (still supported) use of the /LINE qualifiers in
yes? PLOT/LINE=10 I[i=1:3] ! 4(blue) + 6*(2-1)
The available color names are Black, Red, Green, Blue, LightBlue, Purple, and White (not case sensitive), corresponding to the /LINE values 1-6, respectively. (/COLOR also accepts numerical values.) The line thickness may be 1, 2, or 3 corresponding to pixel thickness on the screen or corresponding to multiples of the default line thickness on hard copy. Note that White is only available for THICKNESS=1 (the default thickness).
If /COLOR is given without an argument, the plot line(s) will be drawn starting with color 2, so that the plot lines do not use the same pen as the axes and labels (this feature implemented starting with Ferret v6.85). The following command draws the two lines with the red and green pens:
yes? plot/i=1:20/COLOR 2./i, 3/i
PyFerret Only:
/COLOR=
In PyFerret, the value for the /COLOR= may be specified as a color name or number, as in classic Ferret; or may be of the form (R,G,B) or (R,G,B,A). The values of R, G, B, and A range from zero to 100 and are the percent of red, green, blue, and opacity (alpha channel) for the color. If only R, G, and B are given, an opacity of 100 (opaque) is used.
yes? PLOT/COLOR=(88,100,55) temp
/THICKNESS=
In PyFerret, the value given to /THICKNESS may be any positive real number.
/OPACITY=
In PyFerret, the /OPACITY option can be used to specify the opacity (alpha channel value) of the colors used in the plot. The opacity given by this option will be used even if a color definition includes an opacity.
See the section below, PLOT/RIBBON, for plotting lines colored according to the value of a variable along the line.
Prior to Ferret v5.80, /THICK with no accompanying /COLOR plotted all lines in black. Starting with v5.80 PLOT/THICK for plot lines overlaid on the same plot cycles through the colors Black, Red, Green, Blue, LightBlue and Purple. PLOT/THICK alone produces six in thickness 2 and six in thickness 3.
When plotting a number of lines together with PLOT/OVER/COLOR=/THICKNESS= the default behavior is for symbols to be plotted starting with the seventh line plotted. To plot lines only, add the /LINE qualifier.
After you have created your plot, if you need the lines even thicker to show up properly when printed, see the FAQ, How can I control line thickness when I translate a metafile to a postscript file?
PLOT/COLOR=/THICKNESS=/SYMBOL=/SIZE=
Simple syntax for plots using symbols. For symbol (scatter) plots (PLOT/VS or PLOT/SYMBOL), control the color, size, and line thickness of the symbols with commands such as:
yes? PLOT/COLOR=red/THICKNESS=2/SYMBOL=4/SIZE=0.2 I[i=1:5]
The available color names are Black, Red, Green, Blue, LightBlue, Purple, and White (not case sensitive), corresponding to the /LINE values 1-6, respectively. (/COLOR also accepts numerical values.) The line thickness may be 1, 2, or 3 corresponding to pixel thickness on the screen or corresponding to multiples of the default line thickness on hard copy; note that White is only available in the default THICKNESS=1. The /SIZE is given in units of "inches", consistent with the PLOT+ usage of "inches". (These are the same units as in, say, "ppl axlen 8,6", to specify plot axes of lengths 8 and 6 inches for horizontal and vertical axes, respectively.)
(New qalifier with version 5.4) Simple syntax control over the dash characteristics using the same arguments as in the PPLUS "LINE" command: DOWN1, UP1, DOWN2, UP2, where these are in inches. For simple dashes let DOWN1=DOWN2 and UP1=UP2. For alternating long and short dashes, make DOWN2 longer or shorter. The parentheses are optional.
Example:
yes? PLOT/DASH/I=1:100 sin(i/5)
yes? PLOT/OVER/DASH=(0.3,0.1,0.3,0.1)/COLOR=RED/THICK/I=1:100 sin(i/7)
yes? PLOT/OVER/DASH=(0.6,0.2,0.1,0.2)/COLOR=RED/THICK/I=1:100 sin(i/9)
The /LINE qualifier without =n causes the PLOT command to connect the plotted points with a line regardless of the state of the /SYMBOLS qualifier.
For simpler specification of line characteristics see PLOT/COLOR=/THICKNESS=/DASH=, above. /LINE=n specifies a pre-defined line style. "n" is an integer between 1 and 18. GO line_thickness draw samples of the line colors and thickness:
Line style "1" is always a solid line in the foreground color (black or white). Other line styles are device dependent (colors or dash patterns). For color devices, n=1–6 draws single-thickness lines each a different color. n=7–12 draws double-thick lines in the same color order, and n=13–18 draws triple-thick lines. See the chapter "Customizing Plots", section "Text and line colors" for a chart of the default colors.
If more than 18 different plot lines are drawn using PLOT var1, var2, ... or with PLOT/OVER, then Ferret starts making symbols on the plots
Suppresses all plot labels.
Causes the indicated field(s) to be overlaid on the existing plot. This qualifier can also be used to overlay lines or symbols on 2D plots (SHADE, CONTOUR, or VECTOR) provided the axis scalings are appropriate.
Performs all the internal preparations required by program Ferret for plotting but does not actually render the plot. The command PPL can then be used to make changes to the plot prior to producing output with the PPL PLOT command. This makes possible certain customizations that are not possible with Ferret command qualifiers. See the chapter "Customizing Plots".
The /SYMBOL qualifier causes the PLOT command to mark each plotted point with a symbol. If the /LINE qualifier is given too the symbols are also connected with a line; if /LINE is omitted no connecting line is drawn. For standard (non-ribbon) plots symbols may be colored using the color given with the /COLOR qualifier. For Ribbon plots, colors are controlled by the /PALETTE qualifier.
Optionally, the symbol number may be explicitly specified as an integer value between 1 and 88. In Pyferret additional symbols are specified with a symbol name.
The integer refers to the PPLUS plot marker numbers (e.g., 1 for x, 3 for +, etc.). Type "GO show_symbols" and "GO show_88_syms" at the Ferret prompt to see the available symbols and their reference numbers. Here are those symbols:

PLOT/SYMBOL=DOT
In Ferret, this command uses the smallest dot that can be represented on the display device. Note that the dots may not show up well on all devices or graphics output files.
PLOT/SYMBOL=symname In PyFerret, (v7.4) additional symbols are defined, and are referenced using PLOT/SYMBOL=name. The filled symbols may also be outlined with a second color using /HIGHLIGHT. A set of pre-defined symbols is included with PyFerret. Additionally custom symbols may be defined by the user, as discussed below.
To see the included symbols, run the script "GO show_py_syms" at the PyFerret prompt to see the pre-defined symbols and their names. Here are the pre-defined symbols and their names:

PLOT/SYMBOL=name/HIGHLIGHT[=color] When given along with a named PyFerret filled symbol, /HIGHLIGHT outlines the symbol in a thin line. An optional line color may be given, to outline the symbol in that color. The default highlight color is black. If the symbol is not a filled symbol /HIGHLIGHT is ignored.
Example: left: Fancy combinations of symbols using color, size and highlighting. right: RIBBON plot with filled symbols colored according to a color palette.
yes? set view left
yes? plot/vs/sym=boxfill/color=red/highlight/size=0.4/nokey/hlim=0:6/vlim=0:6/nolabel  {1,2,3,4,5}, {2,2,2,2,2}
yes? plot/vs/over/nolab/sym=boxfill/color=green/size=0.14   {1,2,3,4,5}, {2,2,2,2,2}
yes? plot/vs/over/nolab/sym=circfill/color=lightblue/highlight/size=0.4  {1,2,3,4,5}, {4,4,4,4,4}
yes? plot/over/vs/nolab/sym=circplus/size=0.3  {1,2,3,4,5}, {4,4,4,4,4}

yes? set view right
yes? let xpts = x[x=1:10]
yes? let ypts = xpts
yes? ribbon/vs/nolab/sym=diamfill/highlight/size=.3 \
 /palette=blue_green_gold/levels=10/key=center \
 /hlim=0:11/vlim=0:11 xpts, ypts, xpts

PyFerret symbol definition files
Pyferret named symbols are defined in .sym files. These are text files listing the coordinates that define a shape to be drawn as plot symbols. They are given as normalized in a range of -100 to 100. These files reside in the directory referenced by the environment FER_PALETTE, along with color-palette files. As with color palettes, the user can define custom symbol files.
For instance, here is the contents of the file boxempty.sym:
> cat /usr/local/ferret_dir/palettes/boxem.sym
! hollow square; origin at center
 31.36  31.36
 31.36 -31.36
-31.36 -31.36
-31.36  31.36
 31.36  31.36
If the symbol may be outlined, such as a filled shape, the word FILL appears at the end of the .sym file. Here is the contents of boxfill.sym.
> cat /usr/local/ferret_dir/palettes/boxfill.sym
! filled square; origin at center
 35.36  35.36
 35.36 -35.36
-35.36 -35.36
-35.36  35.36
 35.36  35.36
FILL
To define a custom symbol shape, create a similar file. For closed shapes, the last coordinate pair must duplicate the first coordinate pair. Give the file a distinct name. The name without its extension will become the symbol name referenced in scripts. The symbols that are included in the PyFerret distribution are unique to the first four characters. Put the file in a directory that is included in the path list of the environment variable FER_PALETTE.
FILL is included in many of the symbol files that are not polygons enclosing the shape. For instance, look at the contents of vline.sym, which describes a rectangle of zero width.
> cat /usr/local/ferret_dir/palettes/vline.sym
! vertical line patten symbol
  4.00  50.00
  4.00 -50.00
 -4.00 -50.00
 -4.00  50.00
  4.00  50.00
FILL
When /HLIGHLIGHT is used with these symbols, the symbol is drawn with a thin outline. Try this:
yes? plot/over/vs/nolab/sym=asterisk/highlight=red/color=lightblue/siz=0.6 xpts, ypts

On a line plot that has symbols, draw a symbol at every nth point only. A line plot with symbols has one symbol at each data location. Some such lines (such as the plots generated with PLOT/ALONG), may have symbols that are so dense it is hard to see the individual symbols. When the intent of the symbols is simply to distinguish one line from another, use /SKIPSYM= to plot only every nth symbol along the line. The full density of points is used to draw the line itself; only the symbol drawing is decimated.
Allows user to specify a plot title (enclosed in quotation marks). Without this qualifier Ferret uses the variables's defined title (e.g. the long_name attribute from a netCDR file or the title defined with a LET/TITLE= definition), or a title based on information about the expression(s).
Causes the horizontal and vertical axes to be interchanged. By default the X axis is drawn horizontally on the plot and the Y and Z axes are drawn vertically. For Y-Z plots the Z data axis is vertical by default.
Specifies that the first expression given in the command line is to be used as the independent axis.
PLOT/VS implies /SYMBOL by default to produce scatter plots.
Example:
yes? PLOT/Y=20S:20N/X=180/T=27740:27741/Z=100/VS temp, salt
Produces a plot of salinity (vertical axis) against temperature (horizontal axis) along the indicated range of latitudes and times. The plot will be labeled "salt"; the vertical (dependent) variable is the one that determines the key. The qualifier /TRANSPOSE can be used in conjunction with /VS to further manipulate the labeling and axis orientation.
Use PLOT/VS/LINE to produce a line plot, and PLOT/VS/DASH[=] to plot a dash line and optionally set its characteristics.
In a PLOT/VS plot, if the units of the x-points variable has units of longitude and/or if the units of the y-points variable is units of latitude, then the axes are drawn as formatted longitude and latitude axes.
If a PLOT/VS plot consists of points overlaid on a longitude-latitude map, and if the units of the x-points variable is set to units of longitude (degrees_east), then a modulo operation is done so that the values of xpts do not have to lie in the same longitude branch as the map. For example,
yes? use etopo20
yes? shade/x=-180:180 rose
yes? let/units=degrees_east xlon = {50,100,150,200,250,300}
yes? let/units=degrees_north ylat = {10, 10, 10, 10, 10, 10}
yes? plot/vs/over/nolab/color=black/thick xlon, ylat
If the units of either of the variables in a PLOT/VS plot are defined to represent time units and a time origin, then a formatted time axis is drawn.
yes? file/var="temp, timeday" mydata.dat
yes? set var/units="degrees C" temp
yes? set var/units="days since 01-jan-2012" timeday
yes? plot/vs/line timeday, temp
For PLOT/VS, the range of the plot axes is set according to the range of the data in the two variables. Prior to V7.63, this meant that some plot points would lie exactly on the axis lines. Beginning with V7.63, when drawing a PLOT/VS plot, the axes are drawn with an approximately 1% "buffer" so that points do not lie on the axes. Note that the range of the axes of any plot can always be controlled with PLOT/HLIM= /VLIM=
PLOT/STEP give a plot style that is consistent with grid cell interpretation of data.This is especially useful for time series to show the span of each time bin. /STEP=CONNECTED draws a line segment between the steps.
Specifies axis range and tic interval for the horizontal axis. Without this qualifier Ferret selects a reasonable range.
yes? PLOT/HLIMITS=lo:hi:[increment] [expression(s)]
The optional "increment" parameter determines tic mark spacing on the axis. If the increment is negative, or if HI is less than LO, the axis is reversed.
This qualifier does not have any impact on the context of the expression being plotted. If data is on a modulo x axis but the arguments of the /HLIMITS qualifier represent a region outside the actual coordinates of the data, only the range including the actual coordinates is shown. Use /X=lo:hi or SET REGION or a context on the variable itself, var[X=lo:hi], to set the context for the expression.
The /HLIMITS and /VLIMITS qualifiers will retain their "horizontal" and "vertical" interpretations in the presence of the /TRANSPOSE qualifier. Thus, the addition of /TRANSPOSE to a plotting command mandates the interchange of "H" and "V" on the limits qualifiers.
If the axis is a formatted calendar time axis, we cannot reverse its order by setting LO greater than HI. However, particularly for very long time axes such as those used in paleoclimatology, one gets a reasonable plot by setting
yes? ! For instance if the axis is defined with units of years
yes? cancel mode calendar
yes? plot/hlim=8000:1000  var
Specifies the axis range and tic interval for the vertical axis. See /HLIMITS (above).
yes? PLOT/VLIMITS=lo:hi:[increment] [expression(s)]
The optional "increment" parameter determines tic mark spacing on the axis. If the increment is negative, or if HI is less than LO, the axis is reversed.
PLOT/AXES[=top,bottom,left,right]
Turns plotting of individual axes off and on. This replaces the use of the "PPL AXSET" command. The syntax is
yes? PLOT/AXES[=top,bottom,left,right] var
where the arguments are 1 to turn the axis on and 0 to turn it off. For example:
yes? PLOT/AXES=0,1,1,0 sst ! Draws the bottom and left axes only
PLOT/NOYADJUST
Avoid resetting the Y origin -- relevant during PLOT commands that require extra room for a large key block under the axes or for viewports that lie close to the bottom of the window where there may not be much room below the Y origin. See the examples for DEFINE VIEWPORT/AXES.
PLOT/HLOG /VLOG
/VLOG sets a vertical log axis, /HLOG sets a horizontal log axis. If /VLIMITS or /HLIMITS is specified, they should be in data units (not log10 axis units). If the axis is a depth axis, an inverse log axis is drawn.
Note: Setting axtype with a PPLUS call before the plot call will not result in a log plot, though setting axis type with PLOT/SET_UP still works as in previous versions.
new syntax:
yes? PLOT/VLOG/VLIMITS=10:1000 my_ fcn ! plots my_fcn on a log axis
Replaces older syntax. The following no longer produces a log plot. As of Version 5.4, the PLOT command resets the status of the axes to linear.
yes? ppl axtype 1, 3
yes? PLOT/VLIMITS=1:3 my_fcn
These commands in the older PPL syntax duplicate the effect of the new /VLOG qualifier.
yes? PLOT/SET_UP/vlimits=1:3 my_fcn ! These commands duplicate the
yes? ppl axtype, 1, 3 ! effect of the new syntax.
yes? ppl plot
PLOT/XLIMITS= /YLIMITS=
XLIMITS and YLIMITS have been deprecated. Please use HLIMITS and VLIMITS instead.
PLOT/GRATICULE[=line specifiers]
(Introduced in Ferret version 5.6) Turns on graticule lines for the horizontal and vertical axes. These are lines across the plot at the tic marks. /GRATICULE sets both horizontal and vertical lines; to set each separately see /HGRATICULE and /VGRATICULE, below. The syntax is
yes? PLOT/GRATICULE[=line or dash,COLOR=,THICKNESS=] var
where the default is a thin, solid black line. The line colors available are Black, Red, Green, Blue, LightBlue, Purple, and White. The thickness codes are 1, 2, or 3 and as for plot lines, thickness=1 is a thin line, thickness=3 is the thickest, and THICK specified with no value defaults to thickness=2. For clarity the arguments to GRAT may be placed in parentheses
yes? PLOT/GRAT/i=1:12 1./i ! default graticules
yes? PLOT/GRAT=(LINE,COLOR=red,THICK=3) var
yes? PLOT/GRAT=(DASH,COLOR=lightblue) var
yes? PLOT/FILL/GRAT=(DASH,COLOR=white) var
The above commands make settings for the large tic marks. If small tic marks are being plotted on the axes, we can make settings for them as well using keywords SMALL and LARGE. Place all of the arguments for the /GRAT qualifier in double quotes. Note that the PPL AXNMTC command sets the plotting of small tics, and that small tics are used by default for many time axes and for logarithmic axes.
yes? DEFINE AXIS/Z zlog=EXP(k[k=1:10])
yes? LET fcn = k[gz=zlog]yes? PLOT/VLOG/GRAT="LARGE(COLOR=red),SMALL(COLOR=lightblue)" fcn
PLOT/HGRATICULE[=line specifiers]/VGRATICULE[=line specifiers]
Turns on graticule lines and sets the line characteristics of the graticule for the horizontal or vertical axis separately. You may specify only one of /HGRAT or /VGRAT if desired. These are lines across the plot at the tic marks. The syntax is
yes? PLOT/HGRATICULE[=line or dash,COLOR=,THICKNESS=] /VGRATICULE=line or dash,COLOR=,THICKNESS=] var
where the default is a thin, solid black line. The line colors available are Black, Red, Green, Blue, LightBlue, Purple, and White. The thickness codes are 1, 2, or 3 and as for plot lines, thickness=1 is a thin line, thickness=3 is the thickest, and THICK specified with no value defaults to thickness=2. For clarity the arguments to HGRAT may be placed in parentheses
yes? PLOT/HGRAT/VGRAT var !this is equivalent to PLOT/GRAT
yes? PLOT/HGRAT=(LINE,COLOR=red,THIICK=3)/VGRAT=(color=green) var
yes? PLOT/HGRAT=(DASH,COLOR=lightblue) var ! horizontal only
The above commands make settings for the large tic marks. If small tic marks are being plotted on the axes, we can make settings for them as well using keywords SMALL and LARGE. Place all of the arguments for the /HGRAT qualifier in double quotes. Note that the PPL AXNMTC command sets the plotting of small tics, and that small tics are used by default for many time axes and for logarithmic axes.
yes? DEFINE AXIS/Z zlog=EXP(k[k=1:10])
yes? LET fcn = k[gz=zlog]yes? PLOT/VLOG/HGR="LARGE(COLOR=red),SMALL(COLOR=lightblue)"/VGRAT fcn
yes? use coads_climatology

yes? ribbon/thick/y=15/l=6/set sst, airt
yes?   go unlabel ($labnum_t)
yes?   go unlabel ($labnum_y)
yes?   ppl title "SST Colored by AIRT, June climatological average at 15N"
yes?   ppl xlab
yes? ppl ribbon
PLOT/NOKEY
Turns off the automatically-generated key showing line types on plots with multiple lines. There are several scripts which will let you position your own keys in the plot window
For a multi-line plot, PLOT/KEY=TITLE tells Ferret to use the variable titles in the legend below the plot. This uses the full title with units, exactly as it would appear on a single-line plot. The FAQ, modifying the legend (key) for a multi line plot gives an example and shows how to call the legend.jnl script for further control over the plot legend.
RIBBON PLOTS
Ribbon plots are color-by-value 1-dimensional plots. The line is colored according to the value of a variable along the line.
PLOT/RIBBON
Color line plots are drawn with the PLOT/RIBBON qualifier, and qualifiers for controlling color palettes and levels are added just as for any 2-dimensional color plot. The alias RIBBON is defined, RIBBON is an alias for PLOT/RIBBON. Add an extra argument to any plot command to specify the color-by variable. The above plot was drawn with the commands:
yes? use coads_climatology
yes? RIBBON/THICK/Y=0/L=6 sst, speh
The title automatically has a second line, "Colored by" with the title and units of the color-by variable. This may be overriden using the /TITLE qualifier to set other title text.
If PLOT/SYMBOL is used, the symbols are drawn in the color corresponding to the value of the color-by variable at the coordinate location. If the color-by variable contains missing values, the line is drawn using a light gray color.
For PLOT/VS commands where there are two arguments listing the horizontal- and vertical- locations of the points to be plotted, a third argument specifies the color-by variable:
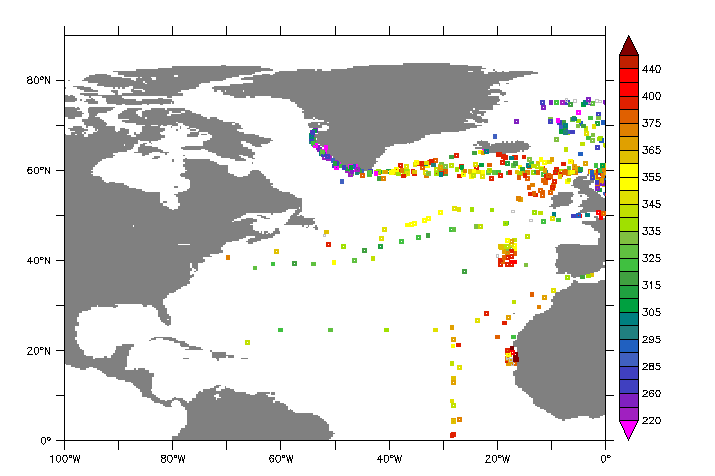
The above is drawn with:
yes? GO basemap x=260:360 y=0:90 20
yes? PLOT/VS/OVER/NOLAB/RIBBON/THICK/SIZE=0.08/SYMBOL=17/KEY/LEV=v  lon, lat, fco2_rec
If you use PLOT/SET_UP/RIBBON, in order to make changes to the plot prior to producing output (See the chapter "Customizing Plots"), then to produce the output, issue a PPL RIBBON command. For example to remove the time and latitude labels from the upper left, change the title, and remove the label "Longitude" from the horizontal axis,
RIBBON /KEY /NOKEY
Turns on the color key. By default it is turned on for a first (underlay) plot; /NOKEY will turn it off. On an overlay plot the color key is not turned on, but may be invoked with /KEY. (This is a dual use of /NOKEY. For non-ribbon plots, /KEY and /NOKEY control the legend below the plot when multiple plot lines are drawn on a plot. See above. )
/KEY options further customize the key. Multiple options may be given, stringing them together with commas, e.g. /KEY=CONT,HORIZ
PyFerret offers an option to customize the text style of the colorbar labels. The text-group "CBAR" specifies a change to the colorbar label text.
RIBBON/KEY=CONTINUOUS
Chooses a continous color key for the palette used in a color-filled contour plot, without lines separating the colors. This option is particularly good for fill plots having many levels. Only valid in conjunction with /PLOT/RIBBON.
RIBBON/KEY=HORIZONTAL
Draws a horizontal key just above a color fill plot.Only valid in conjunction with /PLOT/RIBBON.
RIBBON/KEY=CENTERLAB
Labels the color key in the colors of the key rather than at the line dividing one color from the next. The contour levels used, whether specified with a /LEVELS qualifier or computed by Ferret, correspond to the labeled color blocks along the colorbar. In other colorbar styles, the levels correspond to the equivalent of contour lines between colors. Only valid in conjunction with /PLOT/RIBBON.
RIBBON/LEVELS
All of the LEVELS settings used for FILL or SHADE plots are available for the colors in a ribbon plot. Only valid in conjunction with /PLOT/RIBBON.
RIBBON/PALETTE
Specifies a color palette. Any color palette may be used. Only valid in conjunction with /PLOT/RIBBON.
RIBBON/FAST
By default the colors are interpolated along the path between one point and the next, for a smooth blending of colors from one location to the next. The /FAST qualifier turns off this capability so that each grid cell along the line is colored by the single color corresponding to the value of the function at the coordinate location. Compare:
This was drawn as follows, with the /FAST qualifier on the lower curve but with the same color levels.
yes? RIBBON/VS/LINE/SYMBOL/SIZE=0.2/THICK2 xpts,ypts,var

yes? RIBBON/OVER/VS/LINE/SYMBOL/SIZE=0.2/THICK/FAST/NOLAB xpts,ypts-0.5,var
RIBBON/MISSING
This qualifier offers control over how missing values in the color-by variable are shown. By default they are drawn with a light gray color, and if /LINE is in effect, a thin gray line. The arguments to /MISSING may be
| /MISSING=blank | Draw nothing, e.g. make a gap in the line where the color-by variable is missing |
| /MISSING=palette | Use the first color in the named color palette file to draw points or line where the color-by variable is missing. Single-color palettes such as "black" or "tan" are often the best choices. |
Examples:
yes? RIBBON/OVER/VS/LINE/SYMBOL/SIZE=0.2/THICK/MISSING=blank xpts,ypts-0.5,var

yes? RIBBON/OVER/VS/LINE/THICK/MISSING=pink xpts,ypts-0.5,var
PLOT/RIBBON/VS/GAPLOC
for ribbon/vs plots only, a fourth argument may be given. Its values are 1 and 0; marking locations where the pen should be picked up.
yes? let gapvar = if cruise_number[I=@DDF] NE 1 THEN 1 ELSE 0
yes? plot/vs/ribbon/line/thick/gaploc lon, lat, temp, gapvar
PLOT/DEGMINSEC[=n]
Label any plot axes that represent longitude or latitude with Degrees-Minutes-Seconds instead of degrees and fractions of degrees. The argument is 1 for Degrees-Minutes (which is the default), or 2 for Degrees-Minutes-Seconds.
PLOT/HALFSPACE
For any plot axes that are labeled with longitude or latitude units, add a half-space between the degree sign and the E/W or N/S.
DSG Plots
Beginning with PyFerret/Ferret v7.6, customizations for data in Discrete Sampling Geometries datasets is implemented. The command "PLOT" draws a plot customized to the feature type. See the Tutorial script dsg_tutorial.jnl, and run the demo scripts:
dsg_point_plot.jnl
dsg_prof_plot.jnl
dsg_timeseries_plot.jnl
dsg_traj_plot.jnl
For Trajectory datasets PLOT variable draws a ribbon plot with longitude/latitude trajectory paths colored by the variable. If the variable is the dataset ID, then each trajectory gets its own color
yes? !plots ribbon plots colored by temperature
yes? plot/level=v temperature

yes? ! Plots trajectories, each trajectory in one color
yes? plot/palette=ten_by_levels  trajectory_id
For Timeseries datasets PLOT variable draws a multi-line set of timeseries on a common time axis with lines drawn in distinct line types according to the usual multiple-line style.
For Profile datasets PLOT variable draws a multi-line set of profiles on a common depth or height axis with lines drawn in distinct line types according to the usual multiple-line style.
For Point datasets PLOT variable draws a ribbon plot of disconnected symbols, at the longitude/latitude locations and colored by the variable.
The qualifiers available for the PLOT command may be applied; /RIBBON and /VS are implied for trajectory and point plots. Use /X= /Y= /Z= /T= for region selections. The only exception is that /I= /J= /K= and /L= cannot be used as index values do not map to coordinate ranges.
In addition to the automated styles for plots, other plot commands that apply to scattered data are useful. PLOT/VS or PLOT/VS/RIBBON can be used to make property-property scatter plots,
and using coordinate variables in the commands lets us choose different "slices" through a profile or timeseries dataset.
! a temperature/salinity scatter plot, for data in any of the feature-types
yes? plot/vs/symbol=triufill/color=blue/size=.14 temp, sal  ! a temperature/salinity plot

! for Profile data, all the profiles as a function of time, colored by temperature
yes? ribbon/vs/thick/symbol=17/levels=v time, depth, temp

! for Timeseries data, all the profiles as a function of time, colored by temperature
yes? plot/vs/ribbon/thick/symbol=boxfill  time, latitude, t_25