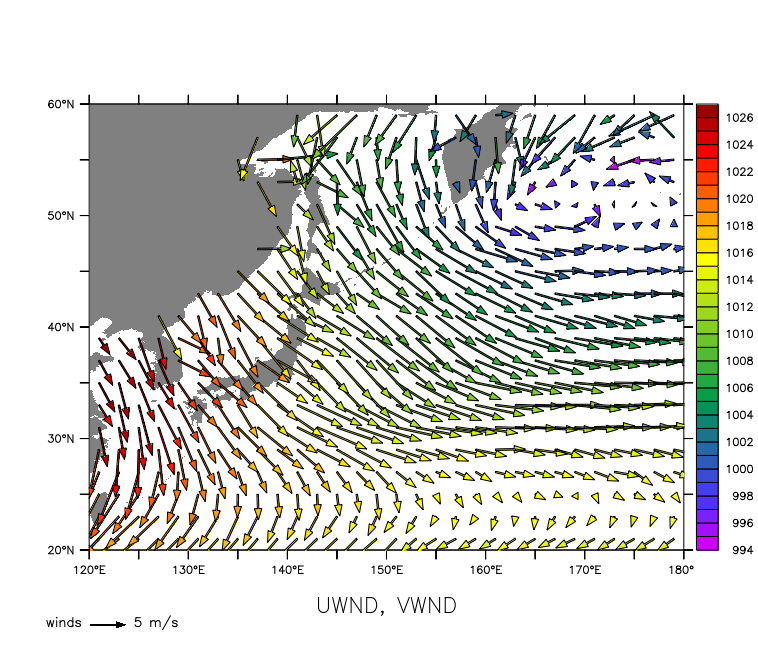
Below is an annotated version of the script poly_vec_demo.jnl
yes? go/help poly_vectors.jnl
Description: demonstrate plotting vectors as filled polygons. Uses poly_vectors.jnl and mp_poly_vectors.jnl scripts contributed by E. D. Cokelet, NOAA/PMEL, 2003. The scripts poly_vectors.jnl and mp_poly_vectors.jnl compute polygon coordinates for drawing vectors in Cartesian or curvlilinear coordinates as polygon arrows or sticks, optionally filled with color. These scripts are similar to scattered_vectors.jnl in that they set up data, which is then plotted with a separate command, in this case, the polygon command. A third script, poly_arrow_key.jnl makes an arrow key at any location on the page.
poly_vectors.jnl must have the plot parameters (such as axis lengths) already set. Draw a 2-D plot over the region of interest, and give it a title.
yes? GO basemap X=120:180 Y=20:60 5
yes? annotate/norm/xpos=0.5/ypos=-0.14/halign=0 "UWND, VWND"
The inputs to poly_vectors.jnl are the X and Y coordinates of the vectors and the components of the vectors to be plotted. We need to limit the region of the data explicitly, so that the calculations are done only for the vectors we are interested in.
yes? use coads_climatology
yes? LET x_vec = X[GX=uwnd,X=120:180] + 0*Y[GY=uwnd,Y=20:60]
yes? LET y_vec = 0*X[GX=uwnd,X=120:180] + Y[GY=uwnd,Y=20:60]
yes? LET u_vec = uwnd[X=120:180,Y=20:60,L=1]
yes? LET v_vec = vwnd[X=120:180,Y=20:60,L=1]

! call poly_vectors to set up the vector drawing
yes? GO poly_vectors.jnl x_vec y_vec u_vec v_vec 5 "arrow"
*** POLY_VECTORS: Issue commands such as follow to plot the vectors ***
*** POLYGON/OVER/NOLABEL/KEY/NOAXES/LINE PLT_X_ARROW, PLT_Y_ARROW, MY_VALUES[J=1:600] ***
*** SET REGION SAVE ***
Now the polygon coordinates have been defined. Next we issue a POLYGON command to draw the arrow polygons. We can use a third argument on the POLYGON command to fill the polygons with colors according to any variable. Here we make a list of the values of sea level pressure which corresponds to the original vector components. The color key is for the fill color. We use the /LINE qualifier to outline the arrows with black. Call poly_arrow_key.jnl to make the vector key.
yes? LET press = YSEQUENCE(slp[X=120:180,Y=20:60,L=1])

! draw the polygons
yes? POLYGON/OVER/NOAX/NOLAB/KEY/LINE/PAL=rainbow plt_x_arrow, plt_y_arrow, press


yes? GO poly_arrow_key "winds", "5 m/s"


