Ferret V6.9 is required for LAS version 8.1
New Features/Enhancements:
1) Enhancements are made to the xml that Ferret writes describing datasets when it is running within LAS.
2) There is a new method to visualize the tree of GO-script calls.
3) A new transformation @STD computes the standard deviation.
4) An axis may be renamed with the SET AXIS/NAME qualifier.
5) Horizontal color bars are now drawn by default right above the plot, with its labels above the color bar.
6) Missing data is now allowed in the coordinate data for 3-argument plot calls
Bug fixes, minor changes:
1) Coordinate axes in datasets are renamed by Ferret because another axis is already defined with the same name but different coordinates. In recent versions we have attempted to write the original axis name when writing data. This cannot be done in a consistent way. We revert to the older behavior of using the internal (renamed) name for coordinate axes when writing data. If the user gives the /SAVE/KEEP_AXISNAMES qualifier, then Ferret will write the axis names from the source dataset, unless there is already a conflicting axis in the file being written.
2) If a SET AXIS/UNITS= command is issued, the units string is saved in the same upper/lower-case spelling as is given in the command. Previously, Ferret changed the units string to uppercase. So, SET AXIS/UNITS="Meters" will show "Meters" and not "METERS" on plots and when saving data.
3) If data in a NetCDF or OPeNDAP dataset is packed, with scale_factor and add_offset attributes, and is stored as short integers, then a request to write that variable gave incorrect results. Now, it is re-packed with the scale_factor and add_offset, and written using the data type of the data in the original file.
4) If a dataset has an axis with axis bounds that define the upper and lower edges of the grid cells, and if those bounds do not enclose the grid points, the invalid bounds variable is made a dependent variable so that the values can be viewed.
5) A bug in which some combinations of multidimensional transformations returned incorrect values is fixed.
6) SHOW GRID/E and SHOW GRID/F returned an error. They now return the correct output when there is an E or F axis.
7) SET AXIS commands, for instance to add units or a time origin to an axis from a dataset, behaved inconsistently when the axis name in the file was lowercase. This is fixed.
8) The color key was mislabeled when a single color was specified by giving a low and high limit. For instance, in the single-color plot of "yes? shade/lev=(0,1000,1000) rose", the upper and lower limits of the key are labeled with 0 and 1000. If a level is set with individual value, "yes? shade/lev=(17) indicator" the label is repeated at the upper and lower edge of the color key.
9) The PPL PALETTE or PPL PATTERN command (or their aliases PALETTE and PATTERN) failed if there was extra space before the palette or pattern file name. This is fixed. It did not occur when the palette is given by a plot command qualifier.
10) In Ferret v6.84, we made NetCDF the default file type for opening datasets (previously it had been descriptor files). With this change, Ferret stopped looking for datasets with the extension .des if no extension was given. This bug is fixed as follows: If no file extension is given on a "USE" or "SET DATA/FORMAT=CDF" command, Ferret now looks in the data directories for a file of type .nc, then .cdf, then .des.
11) The name given to a Ferret symbol "DEFINE SYMBOL symbolname = ..." may now be 120 characters long. Previously these were limited to 30 characters.
12) For extra-large regions in x, a "GO LAND" command to overlay the land outlines drew stray lines drawn across the plot. This is fixed.
13) When writing string variables which come from a netCDF file, the string-dimension name and size from the source file are retained. Previously Ferret created a name STRINGn_nn for the string dimension, with nn being the maximum string length written out.
New Features/Enhancements:
1) Enhancements were made to the xml that Ferret writes describing datasets when it is running within LAS. This version of Ferret is required for LAS v8.1.
2) Method to visualize the tree of GO-script calls.
If a set of scripts is run, with scripts calling multiple other scripts, it is useful to be able to see how the flow of the session went. To enable this, we add some new lines written to standard output. When the setting SET REDIRECT has been made, then on entering or exiting any GO script, Ferret will write a line to the log file that SET REDIRECT is sending output to.
On entering a script, the name of the script is listed together with the arguments exactly as executed, after any symbols or grave-accent expressions are evaluated
!! Enter_GO scriptname <arguments>
on exiting a script, the name of the script is written:
!! Exit_GO scriptname
In addition, a new Unix tool FshowGO will process a log file with such lines, picking out the start of each script, and listing the GO lines, indented to show the nesting of calls. For instance,
yes? SET REDIRECT/journal
yes? go vector_demo
yes? quit
Lines containing !! Enter_GO and !! Exit_GO are in the ferret.jnl file
> FshowGO ferret.jnl
 GO vector_demo
 GO white
 GO land red
 GO fland 60 red basemap
 GO fland 60 black basemap
 GO magnify 1.5
 GO fland 60 red basemap
 GO magnify 1.5
 GO fland 60 red basemap
 GO magnify 1.5
 GO fland 60 red basemap
 GO centered_vectors vector/overlay/title="wind speed" uwnd,vwnd 10
 GO scattered_vectors custom_vectors.dat 10 centered head
 GO vector_commands.jnl
 GO magnify 1
 GO stick_vectors plot/COLOR=red/title=FNOC_winds uwnd vwnd
3) A new transformation @STD computes the standard deviation. The computation is made by dividing by N (as is done in Ferret's @VAR variance transformation).
4) An axis may be renamed with the SET AXIS/NAME qualifier. Note that coordinate axes are used in a global way in any Ferret session, so renaming an axis that appears in multiple grids or datasets will change its name for all.
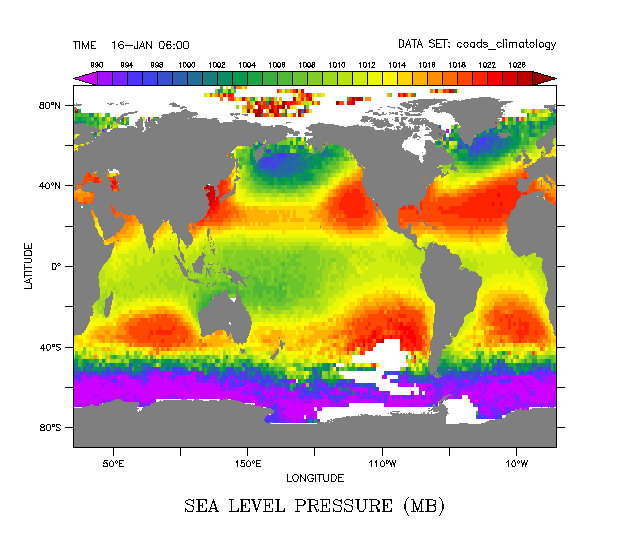
5) A horizontal color bar is now drawn by default right above the plot, with its labels above the color bar. This minimizes interference with the labels in the upper margin. For instance,
yes? use coads_climatology
yes? shade/l=1/lev=v/SET slp
yes? ppl shakey,1,0
yes? ppl shade
Previously the colorbar was drawn well above the plot, on top of other labels, so careful setting of arguments to shakey was needed to make a good-looking plot. In addition, when the labels on the colorbar have many characters, they sometimes overlapped with each other, or ran together. Now the size and/or spacing of the labels is automatically adjusted to avoid this.
Wherever SHAKEY is used in existing scripts, the resulting plot will be unchanged. Here is the image from the above commands:
6) Missing data is allowed in the coordinate variables when using the 3-argument plot commands. Previously Ferret returned an error message and did not draw a plot. Computations with curvilienar coordinates, such as sampling or a regridding function, will still generally require that there be no missing coordinate values.
For instance we may want a longitude - height plot where some of the height values are missing:
yes? shade ua, longitude, geopotential_height
! When missing data in geopotential_height, this previously returned:
! **ERROR: value out of legal range: Y coordinates
!          missing value where val is needed
but now Ferret will draw the plot.
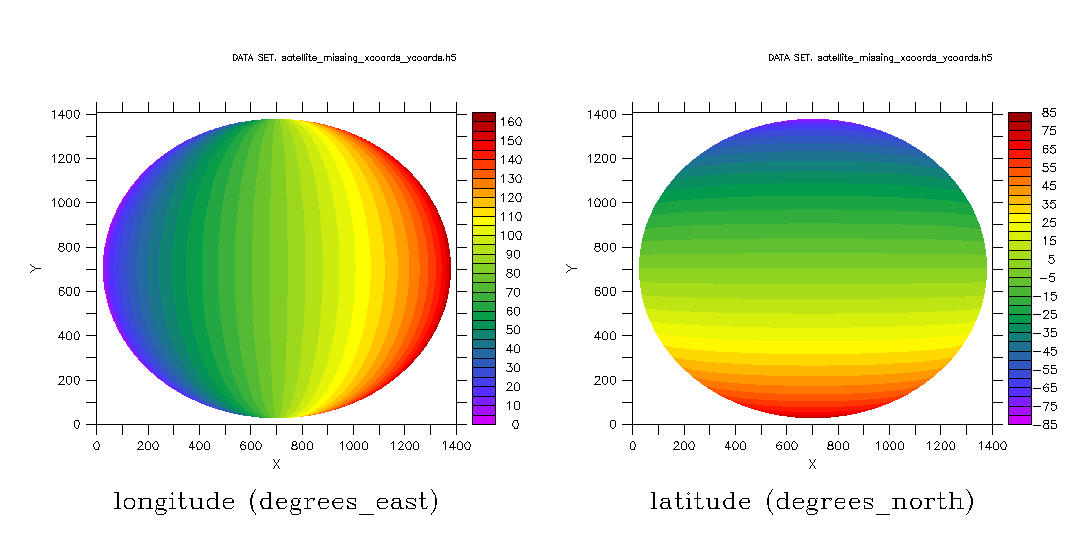
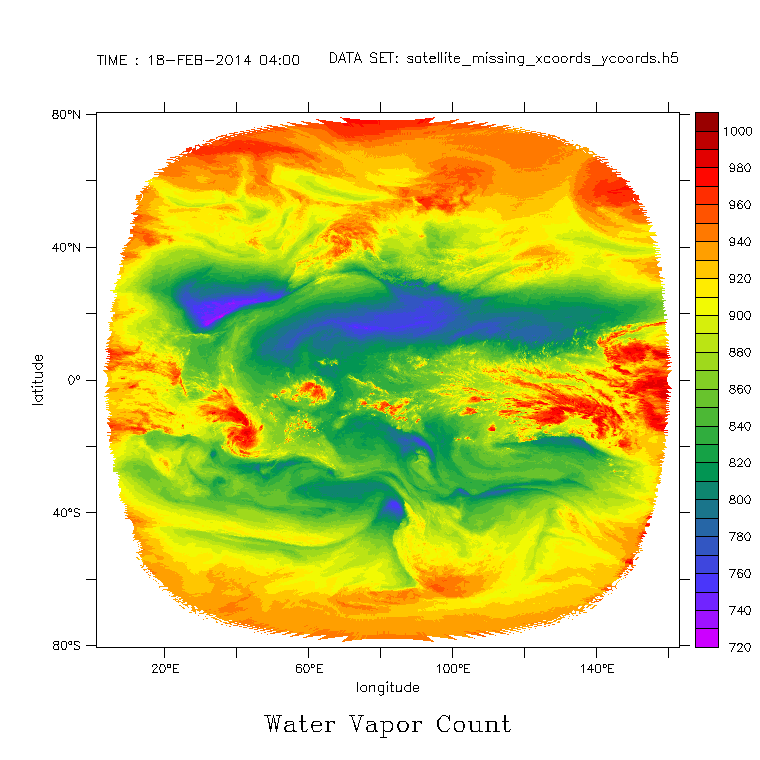
Or there may be data as seen from space with location data given for locations on the earth but missing-values filling the rest of the longitude and latitude arrays:
Here is location data in the I-J arrays:
yes? set view left; shade longitude
yes? set view right; shade latitude
Here is the 3-argument plot using longitude and latitude:
yes? shade water_vapor, longitude, latitude
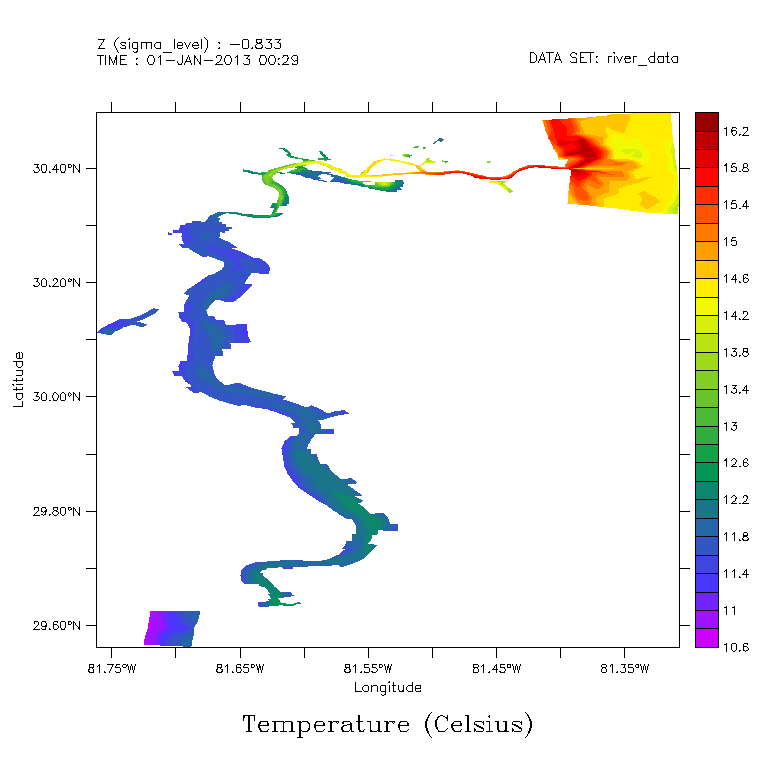
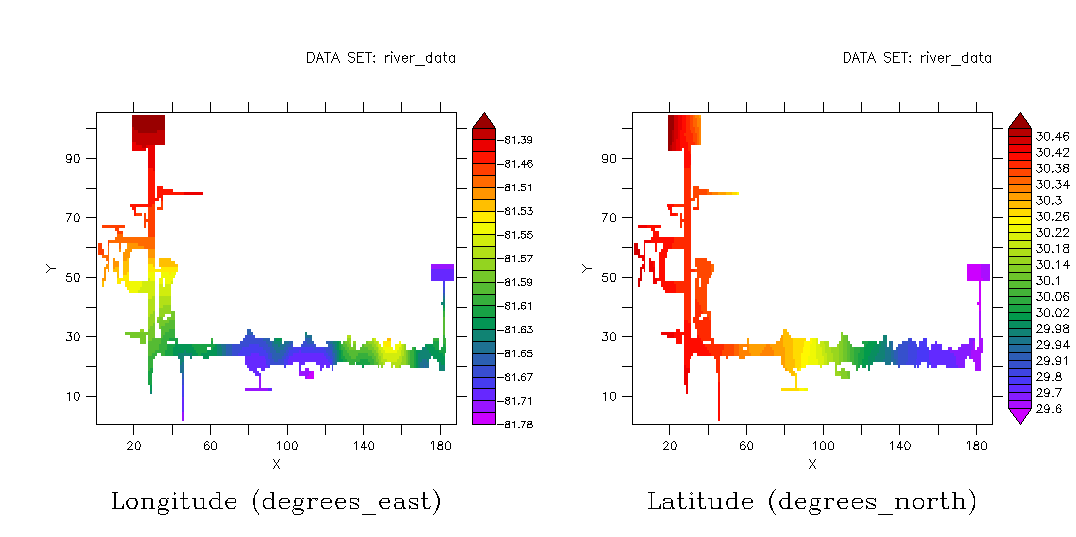
We also find datasets that represent data in an estuary or river, having missing data in the location arrays. The location data plotted in its I-J grid looks like this:
The data has missing values except sy the river locations:
yes? set view left; shade longitude
yes? set view right; shade latitude
Here is the 3-argument plot :
yes? fill temperature, longitude, latitude
