Last modified: Tue, 03/28/2017 - 14:59
Tutorial Image Folder from Plone
-
 levitus tour 7
 - Palette no_white_greenpink_centered
- Under Construction
- KEYMARK example - use KEYMARK,1 to turn on annotation of all color keys with the data min and max.
- tutorial open file
- SET MODE nlevels 40 - yes? set mode nlevels 40 yes? use levitus_climatology yes? shade/K=1 temp
- sigma coordinate image
- simple_zaxreplace_example
- plot with graticules dashed
- v56 graticules on shade plot
- v56 graticules on time plot
- v56 palette topo
- v56 palette topo over smaller region
- v56 graticules on log plot
- v56 single-color palettes for polymarks
- tour image 1
- tour image 2
- tour image 3
- tour image 4
- tour image 5
- tour image 6
- tour image 7
- tour image 7
- tour image 8
- tour image 9
- tour image 9
- tour image 10
- tour image 11
- tour image 12
- tour image 13
- tour image 14
- tour image 15
- tour image 16
- tour image 17
- tour image 18
- tour image 19
- tour image 20
- tour image 21
- tour image 22
- tour image 23
- coads tour 1
- coads tour 2
- coads tour 3
- coads tour 4
- coads tour 5
- coads tour 6
- coads tour 7
- levitus tour 1
- levitus tour 2
- levitus tour 3
- levitus tour 4
- levitus tour 5
- levitus tour 6
 Version 6.72 Release Notes - What's new in the Ferret V6.72 release
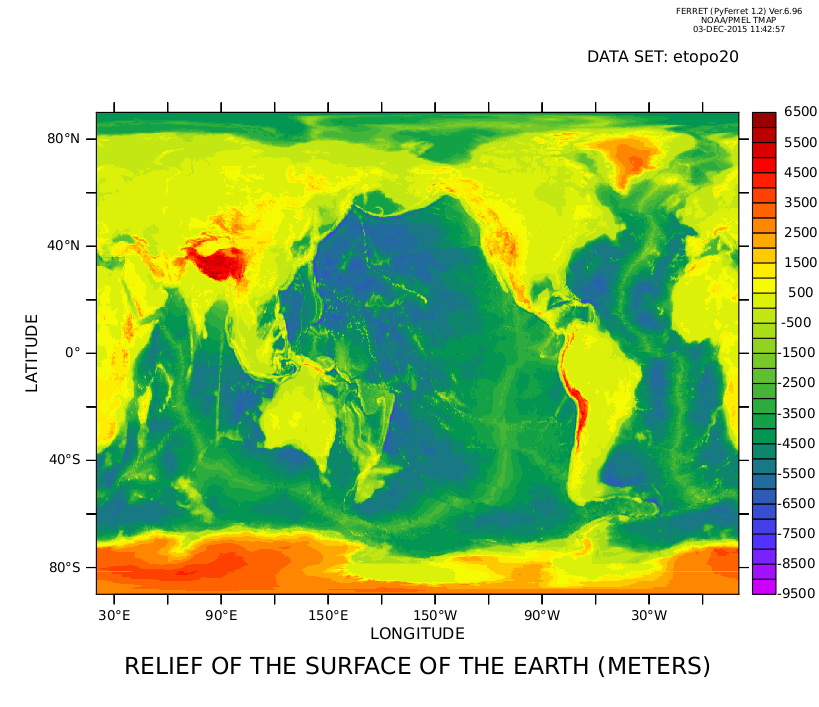
- etopo20 plot
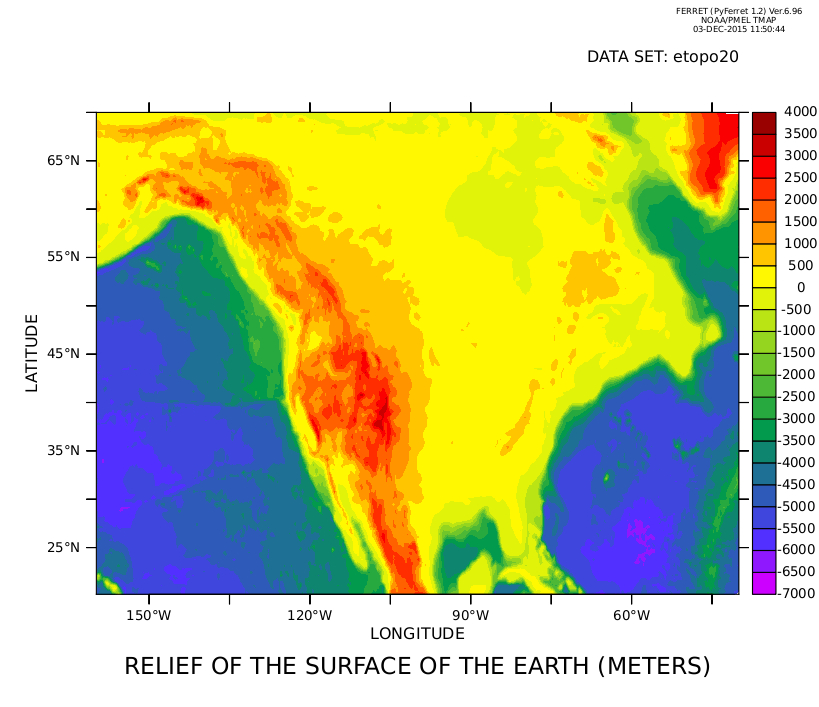
- etopo20 with levels and zooming
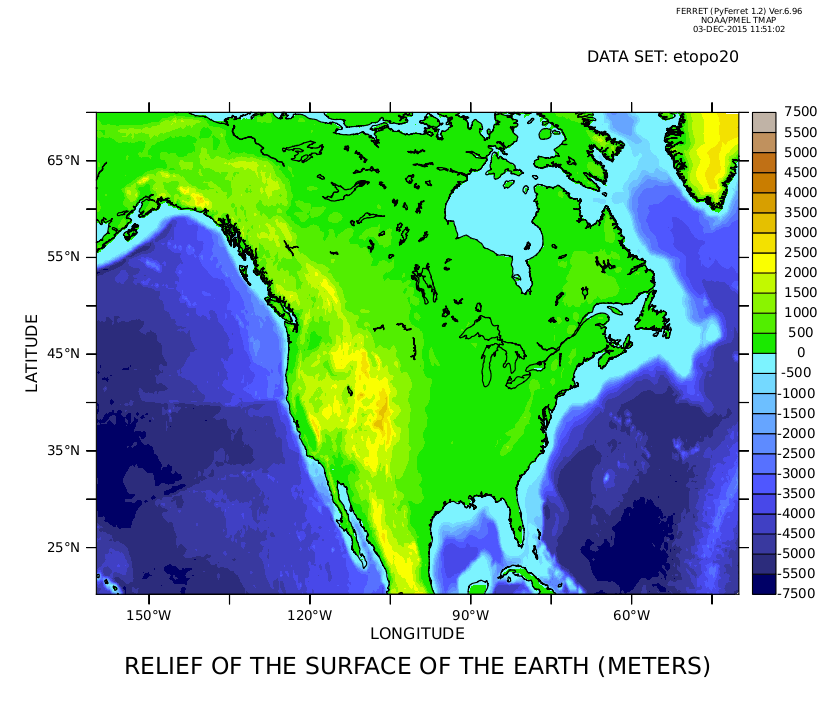
- etopo20 with color palette
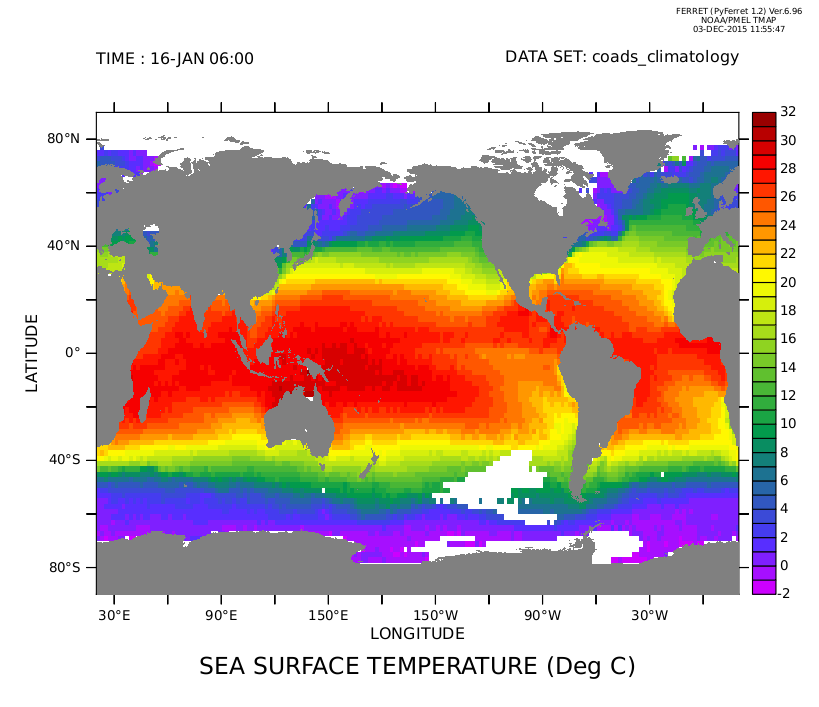
- coads climatology and filled land
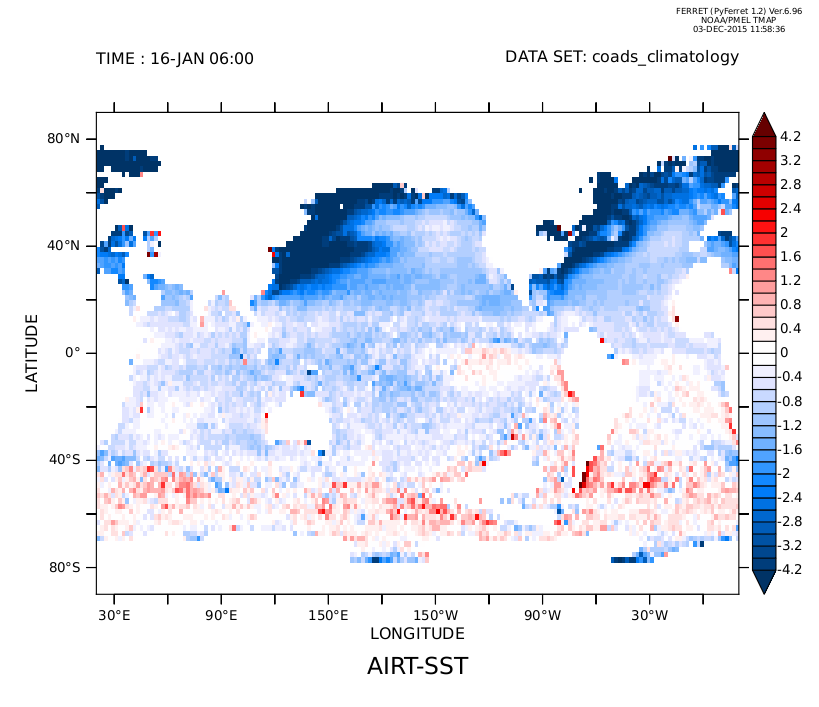
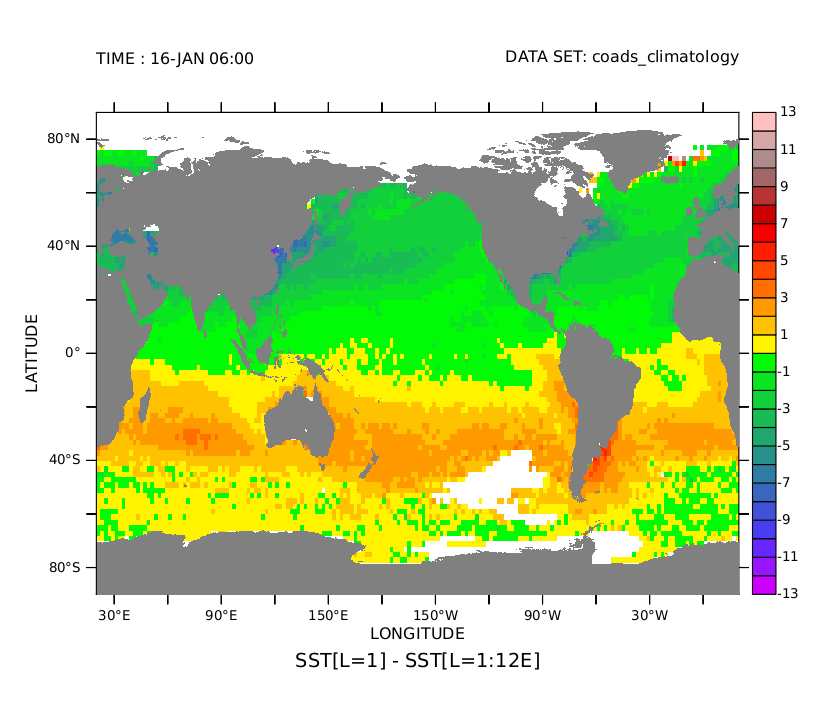
- difference between air and sea temperatures
- difference between air and sea temperatures
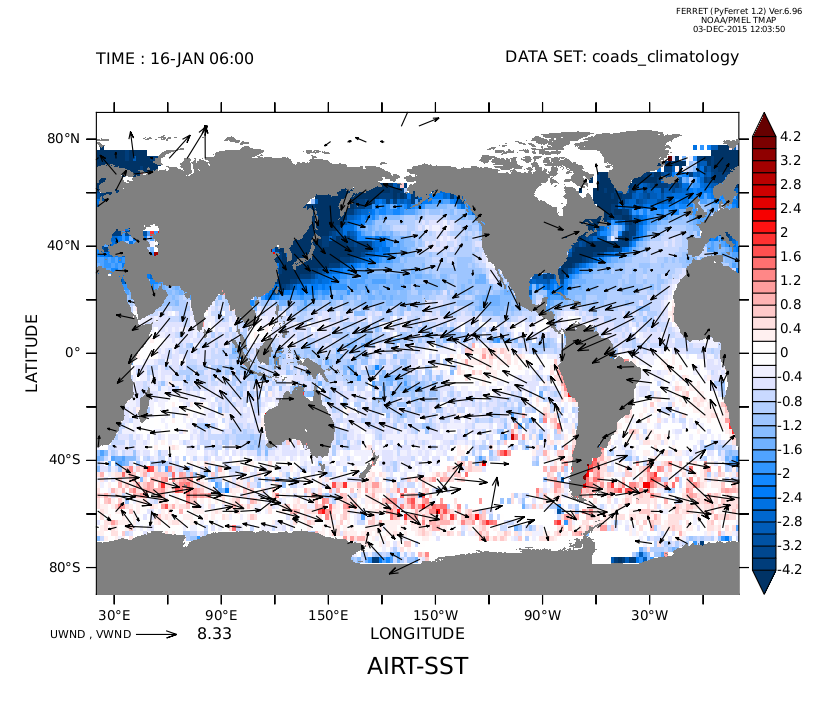
- add wind vectors to the difference plot
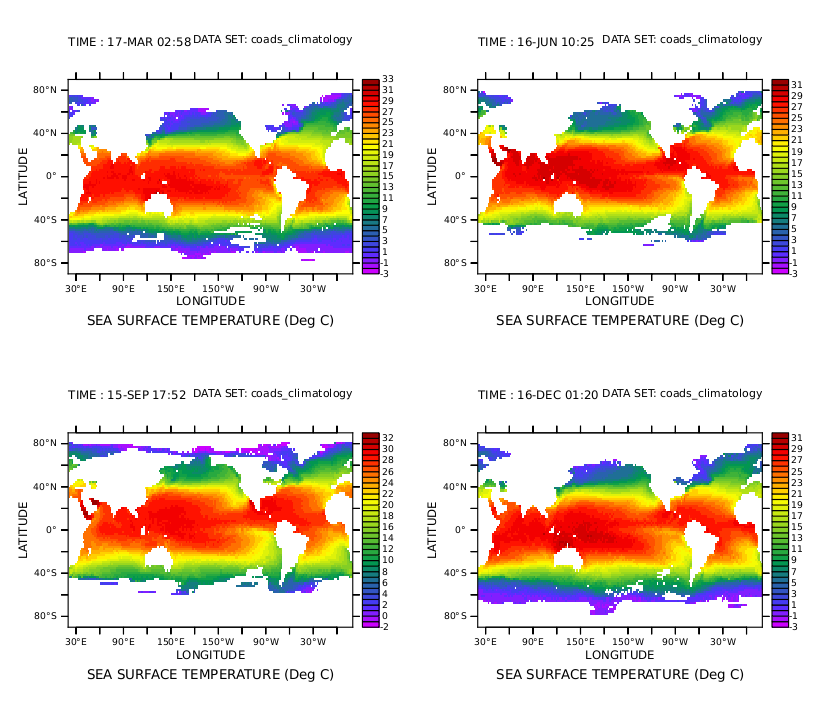
- four seasons of the year
- four seasons of the year
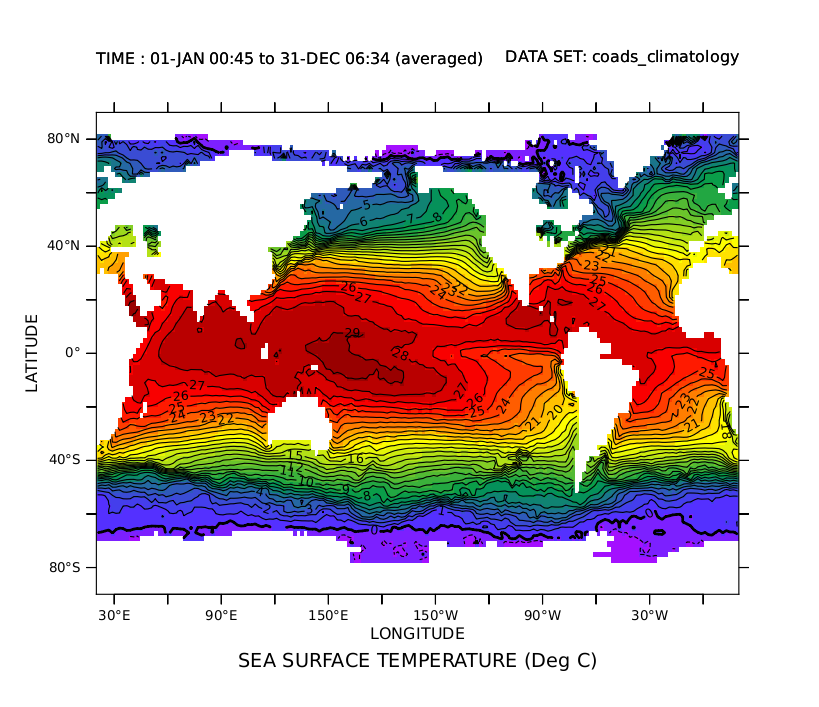
- time average over the year
- anomaly from the mean
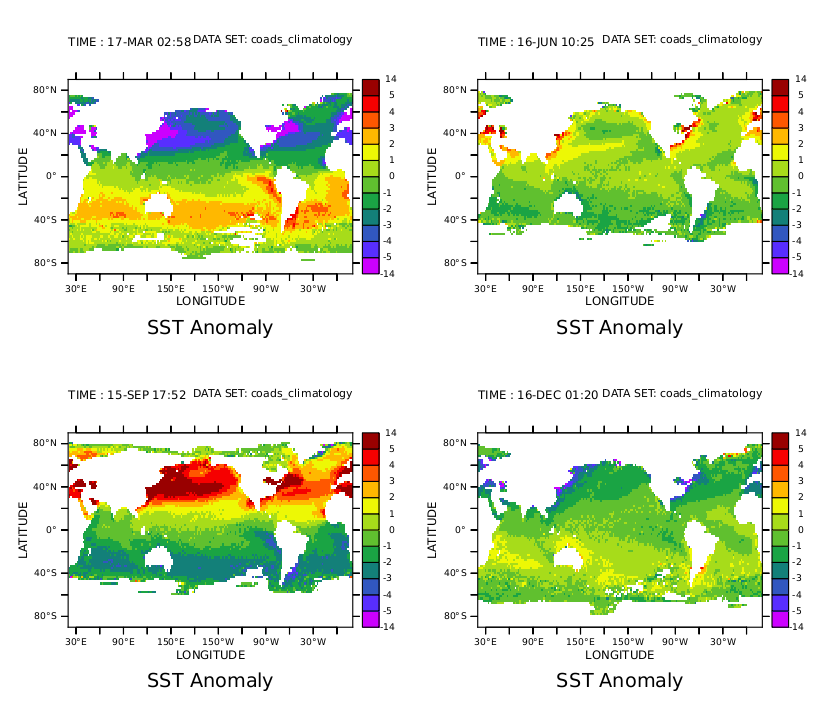
- seasonal anomaly plots
- seasonal anomaly plots
- s
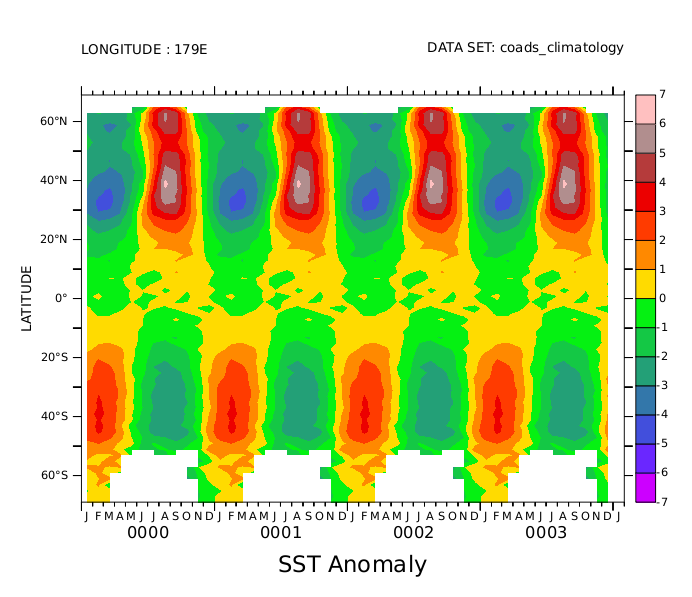
- anomaly time vs latitude
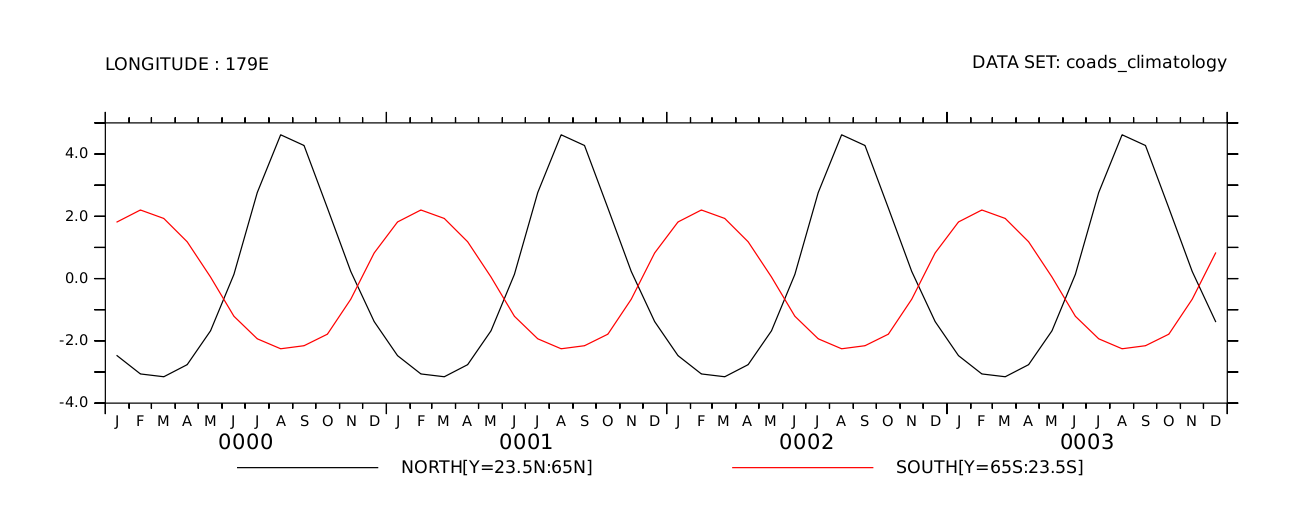
- anomaly time series comparison
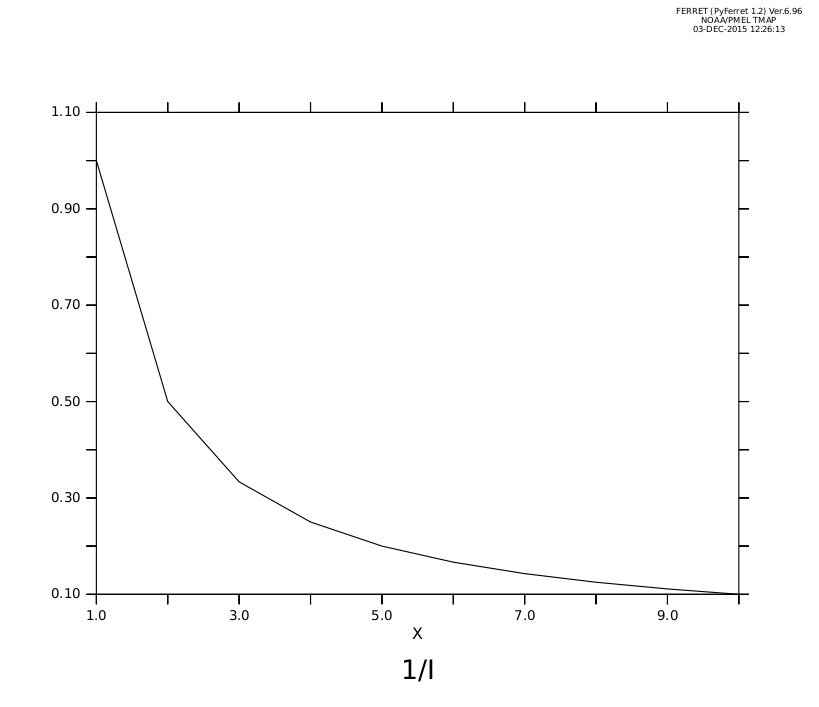
- simple line plot
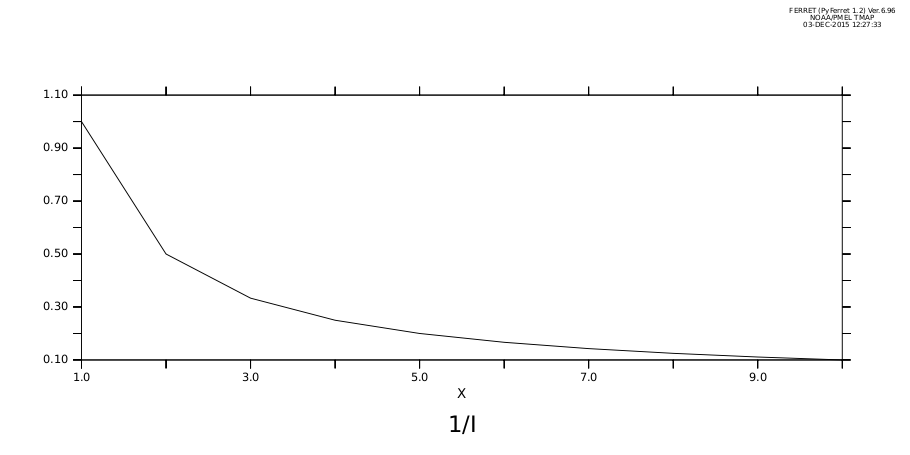
- change the aspect ratio
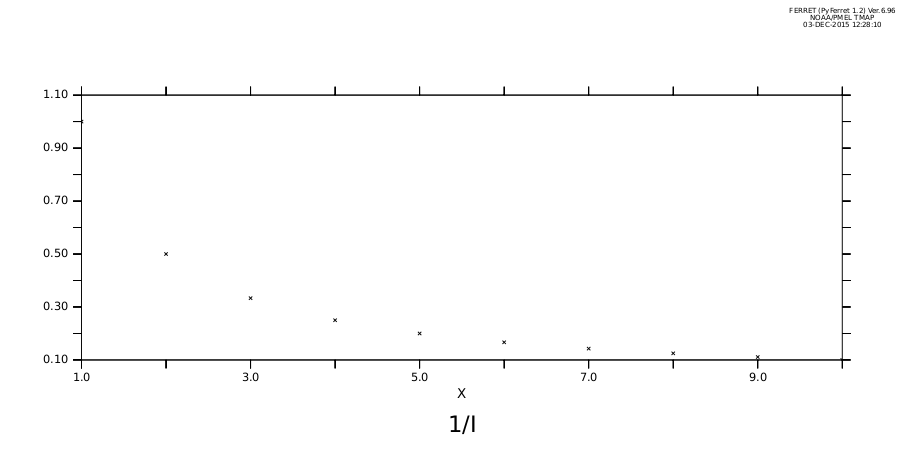
- line plot using symbols
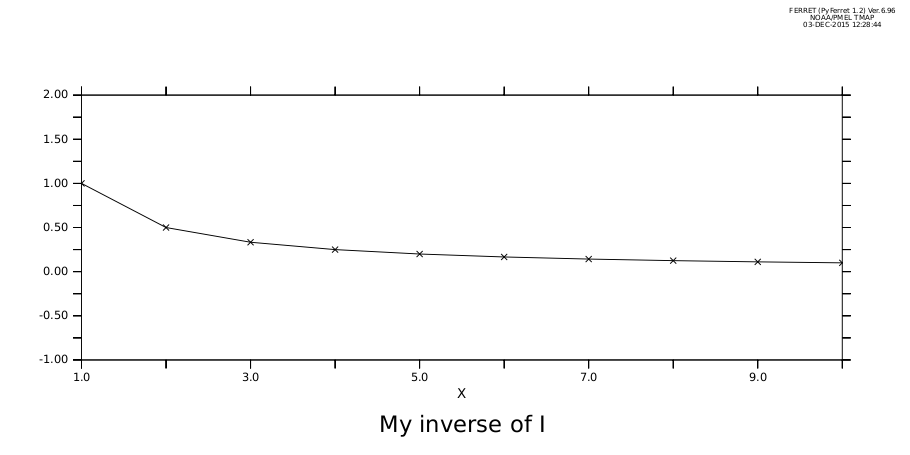
- define a variable
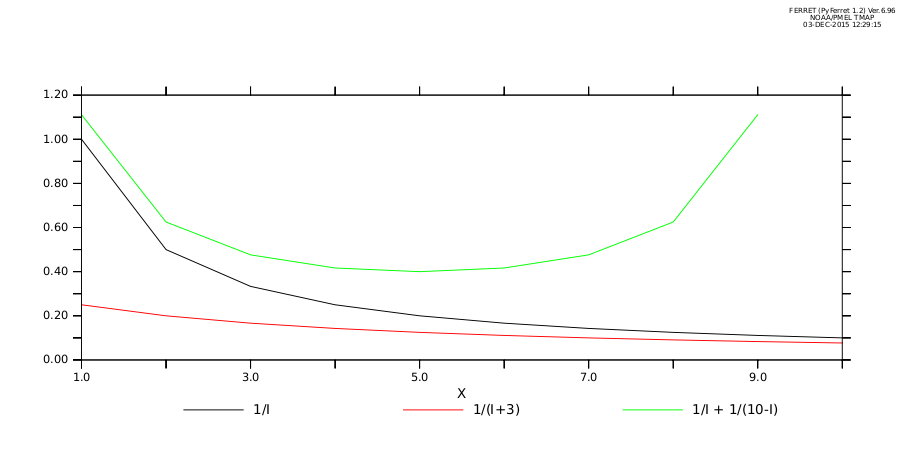
- multiple variables
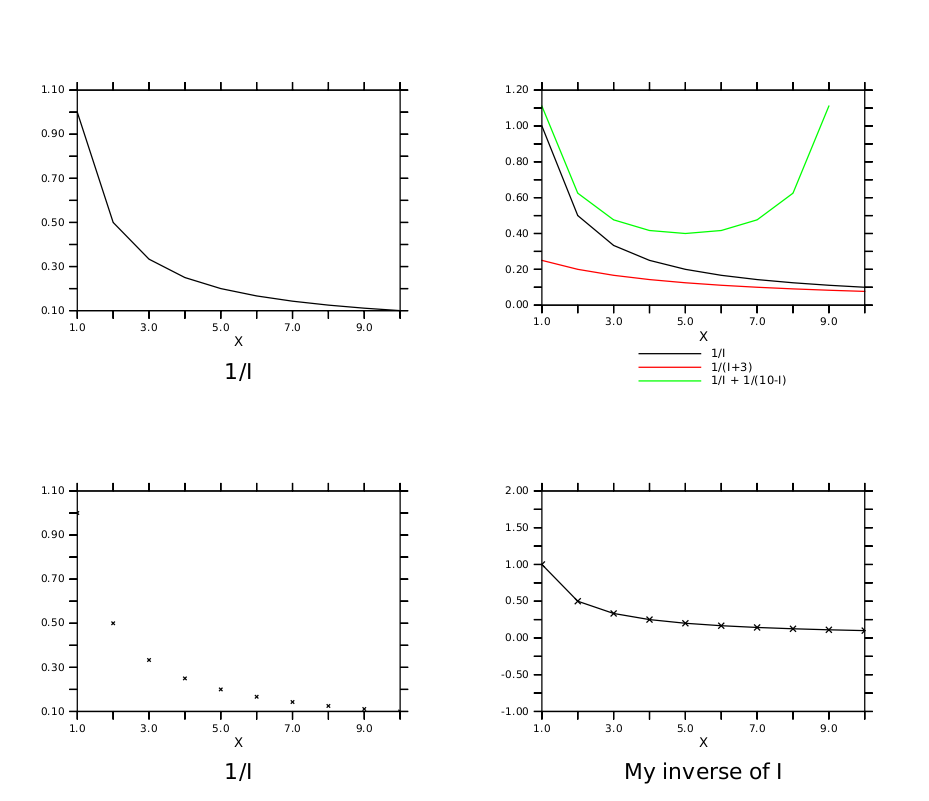
- multiple viewports
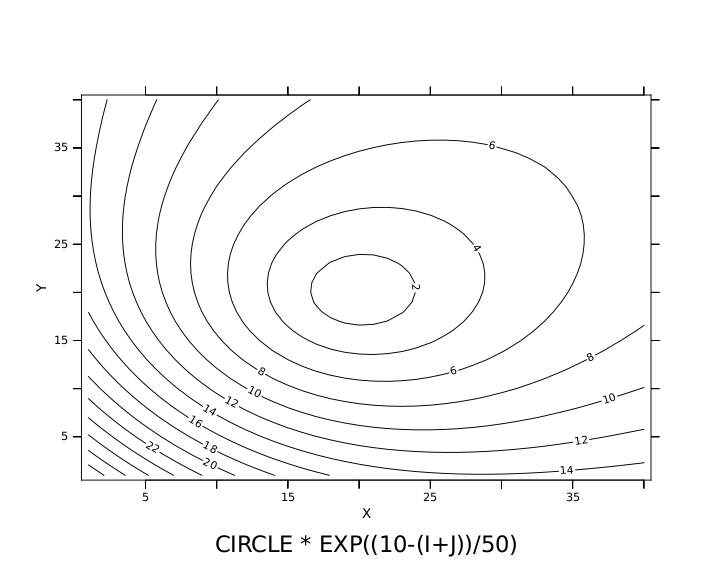
- contour plot
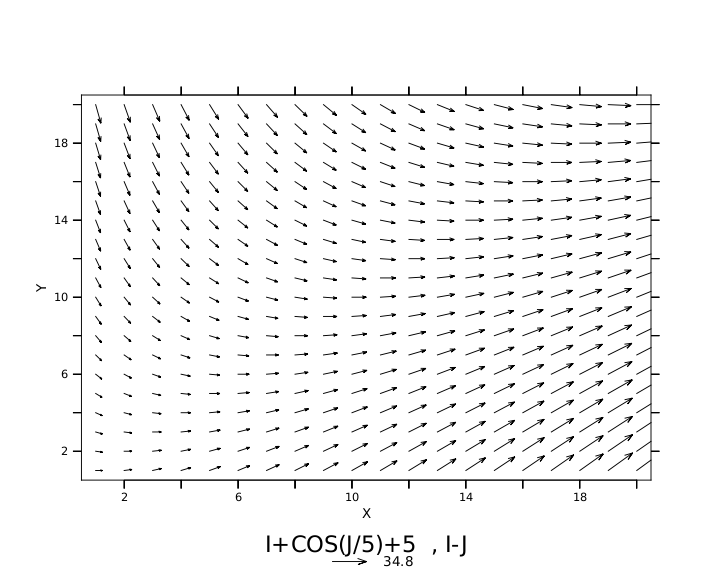
- vector plot
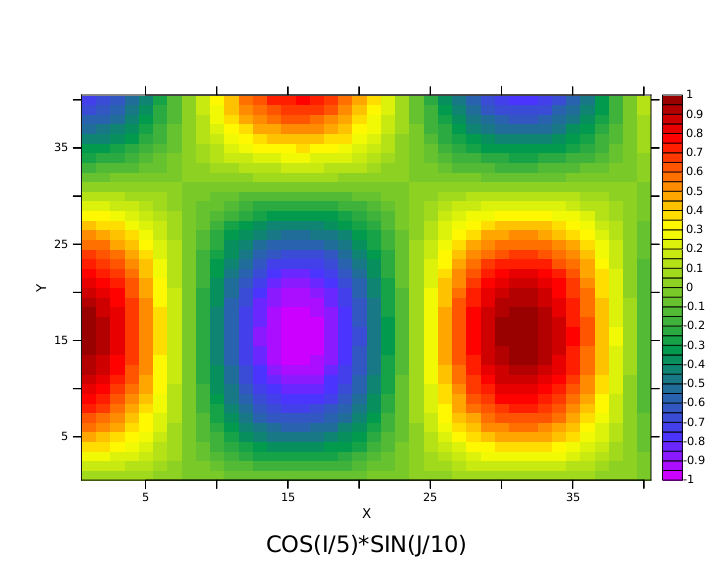
- raster plot
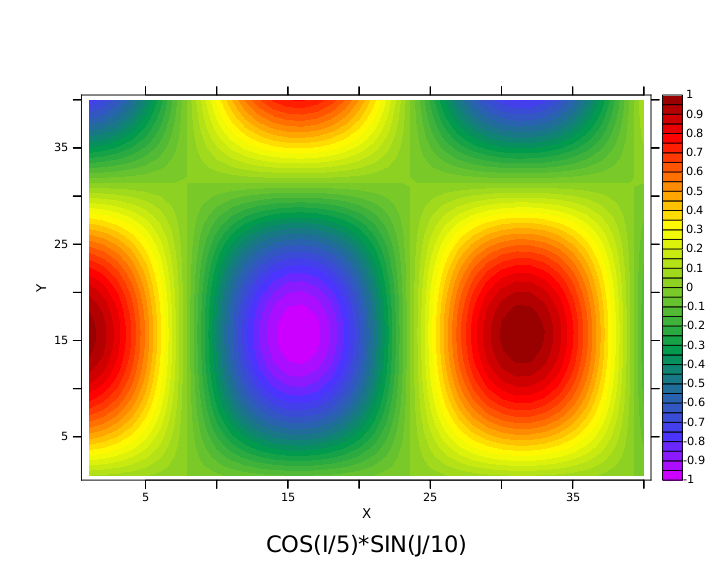
- color filled contour
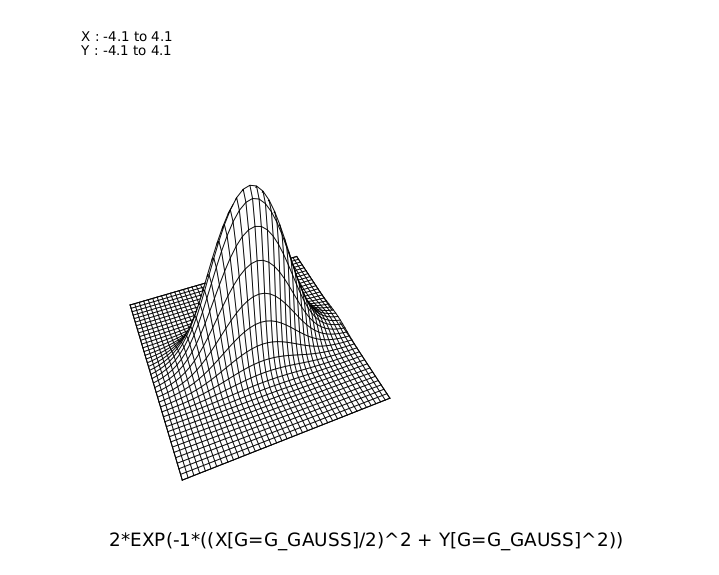
- wire-frame plot
- coads_climatology SST
- opendap_2 coads XT
- opendap_3 reynolds sst
- opendap_4 Reynolds with COADS
- opendap_5 vectors
- opendap_6 hdf reversed
- opendap_7 reversal corrected
- Colored scatter plot, winds