LAS v8.0 (Beta)
A new multi-panel user interface
The latest LAS has a completely redesigned user interface that incorporates the best features of the v7 UI along with the features of the vizGal multi-panel comparison display.
This version of LAS requires Ferret 6.72 or higher. Install the Ferret executables and environment.
Known Issues
Known issues are listed near the bottom of this page.
Comparing plots and hiding controls
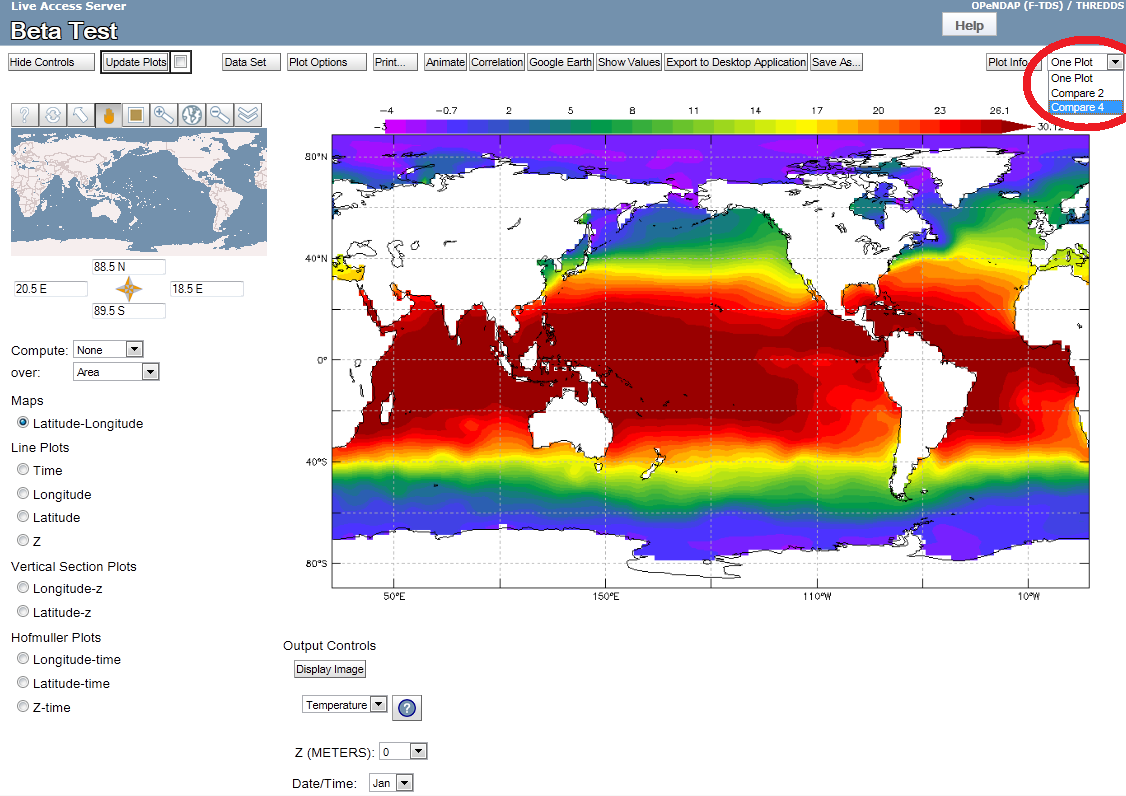
Once one has a desired plot you can choose "Compare 2" or "Compare 4" from the drop-down menu.
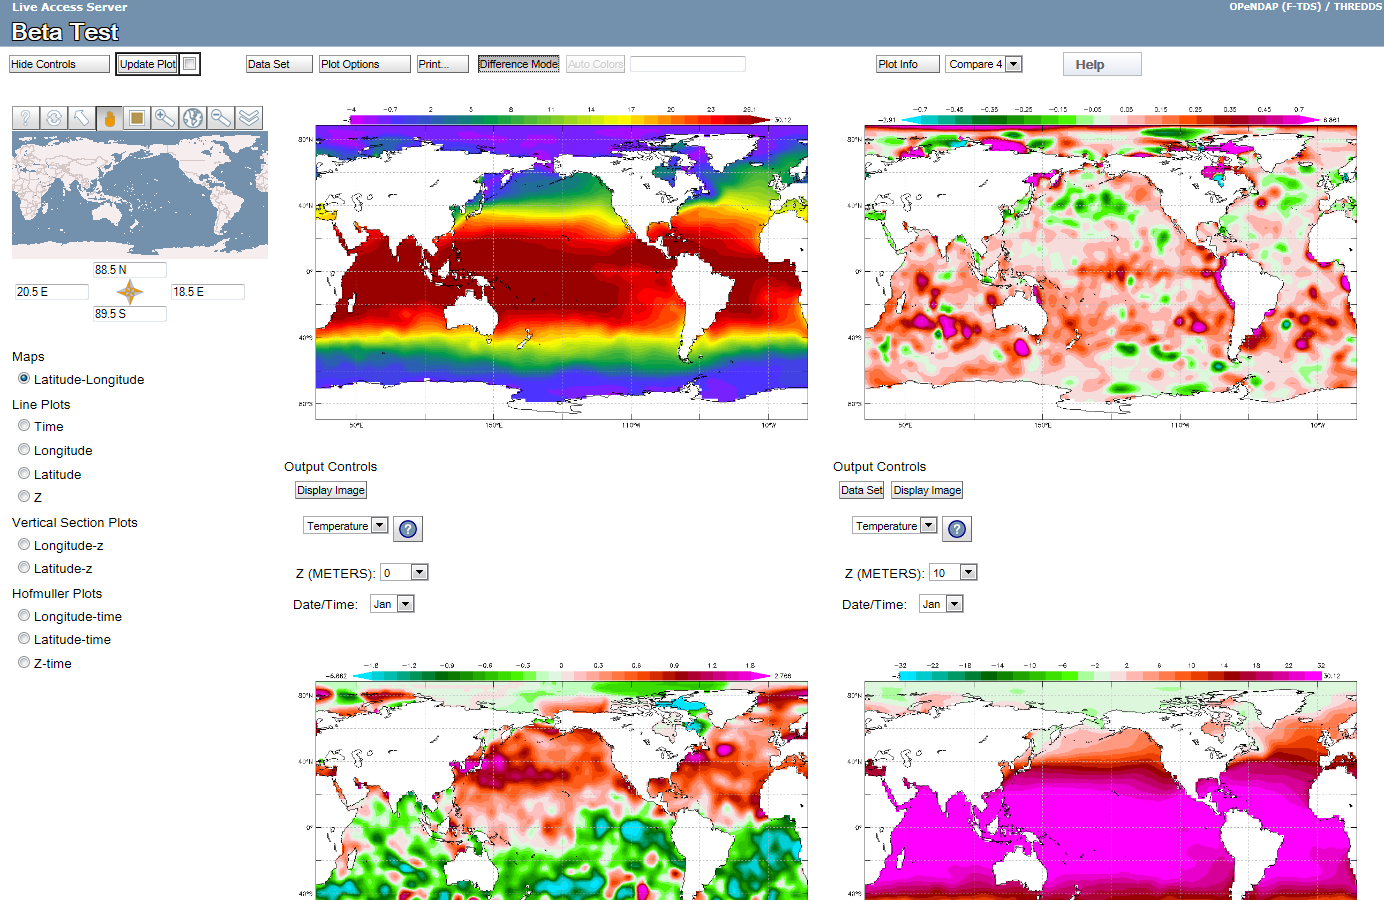
Your LAS page is now in Compare mode, where each individual plot has its own controls below it. You can also click the "Difference Mode" button to compare the 1st main plot in the top-left to the other 3 plots.
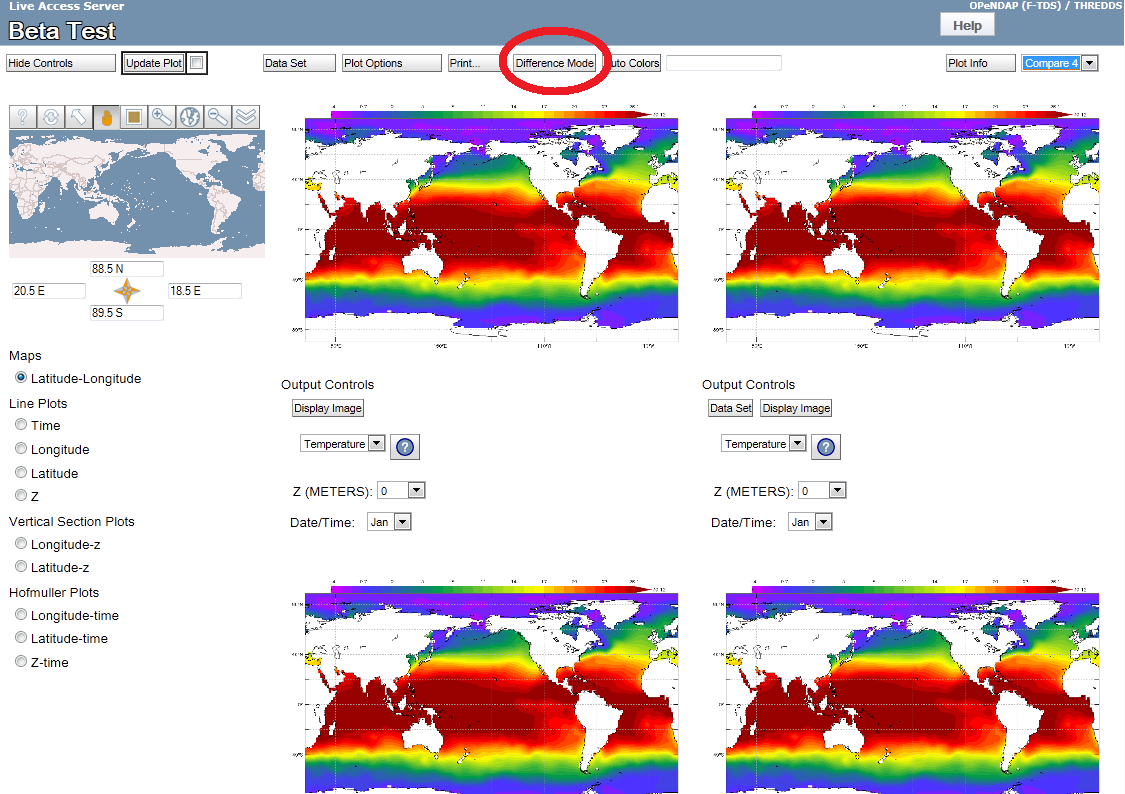
Click the "Difference Mode" button again to stop comparing plots.
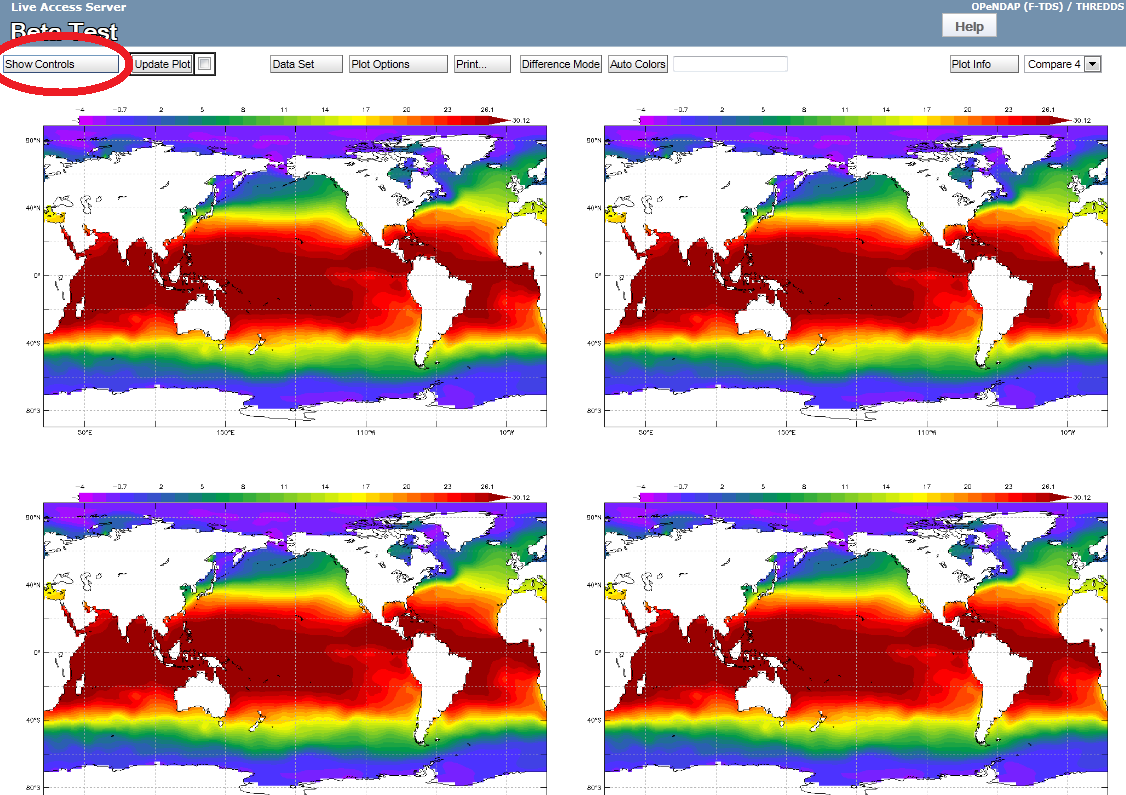
You can also click the "Hide Controls" button to hide all the controls except the top button bar. Click the "Show Controls" button to show them again.
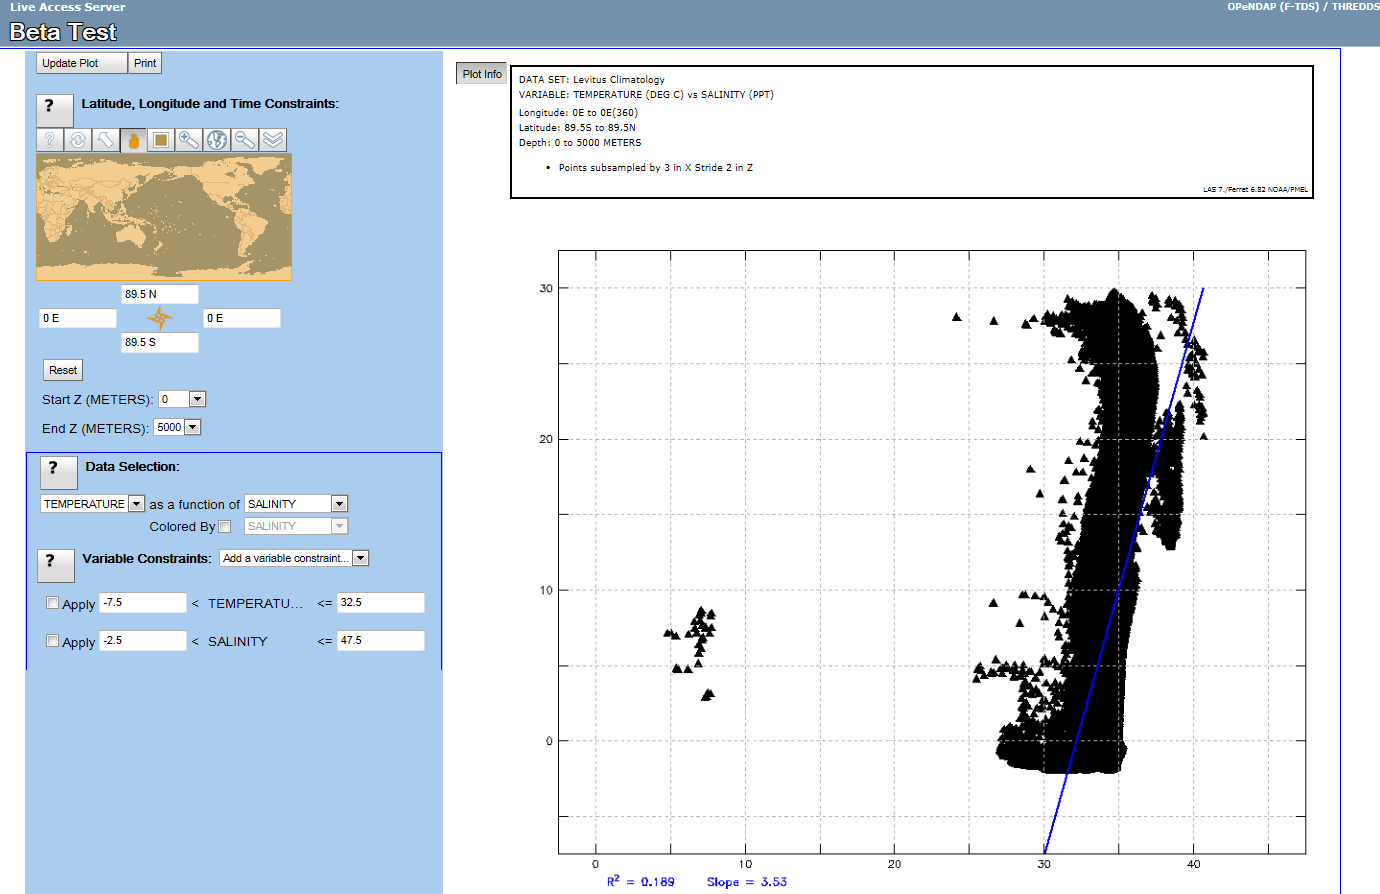
New Correlation Viewer
If you want to view property to property plots, use the new Correlation Viewer:
First you must be viewing only One Plot and you must select a data set that has multiple variables. Click on the "Data Set" button in the top bar, explore the categorical tree, and click on a variable from any data set that has multiple variables (such as "TEMPERATURE" in the example below).
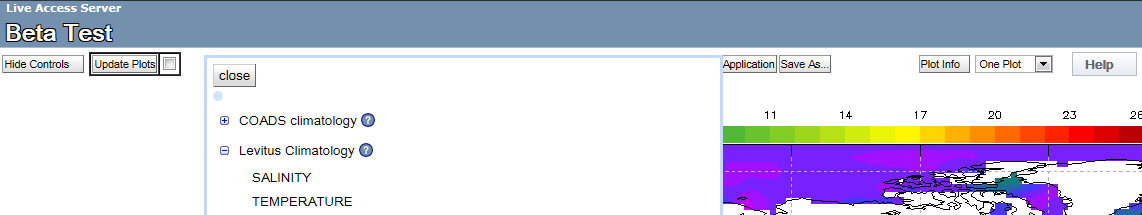
Then click on the "close" button. Once the new plot has loaded, click on the "Correlation" button in the top bar.

Make any changes you want in the options dialog pop-up and then click the "OK" button. A new browser window or tab will open with the Correlation Viewer using the current data set.
History (and URL sharing)
Each time you push the "Update Plot" button, the entire state of the user interface is recorded in the URL. This has two important consequences. First, you can use your browser's "Back" (and "Forward") button. Each time you go forward and back you will see the previous state of the UI including the plots. Secondly, you can bookmark and/or share the URL of the UI state by copying it from the navigation window of your browser. The URLs are necessarily long and complicated, but they can be shortened using popular shortening services on the web.
For example this URL:
http://ferret.pmel.noaa.gov/lasV8/UI.vm#panelHeaderHidden=false;differences=true;autoContour=false;
globalMin=-40.76;globalMax=30;xDSID=coads_climatology_cdf;varid=sst;imageSize=auto;over=xy;
compute=Nonetoken;tlo=15-Jan;thi=15-Jan;dsid=coads_climatology_cdf;varid=sst;xlo=21;xhi=379;ylo=-89;
yhi=89;operation_id=Plot_2D_XY_zoom;view=xytoken;zlo=0;zhi=0;dsid=levitus_climatology_cdf;varid=temp
will open the user interface with two panels and show a plot of the January COADS climatology on the left and the difference between the COADS Climatology and the Levitus Climatology on the right.
You can see a collection of test links for various UI states here: http://ferret.pmel.noaa.gov/lasV8/UITestLinks.html.
User supplied parameters
The history links are generate by the user interface automatically and are a convenient way to share LAS links, they are also long and complicated. You might want to set up a links to a particular data set and variable and sub-region for a Web page or to share. You can build links using the following query parameters:
- dsid - the LAS data set ID of the data you want (using this parameter along will open the data set with and XY plot of the first variable at the first time step over the entire region covered by the data set).
- varid - the LAS variable ID of the data you want.
- xlo and xhi - the minimum and maximum longitude you want.
- ylo and yhi - the minimum and maximum longitude you want.
- zlo and zhi - the minimum and maximum vertical level (if applicable)
- tlo and thi - the minimum and maximum time you want (if applicable)
- operationID - the LAS ID of the operation you want performed
Not all parameters apply for all plots, but the minimum is used in cases where a single value is needed instead of a range.
For example, this URL http://ferret.pmel.noaa.gov/lasV8/getUI.do?dsid=coads_climatology_cdf&varid=sst&tlo=15-Feb&xlo=75&xhi=220&ylo=-45&yhi=45 shows a plot of COADS SST over a sub-region at the February time step.
New Configuration Options
You can now easily specify one of your data sets (and optionally a variable) to be the default data set that is displayed when the bare server URL is accessed. We highly recommend that you do this for your LAS installation.
If you want to make an XY plot the procedure to do this is as follows:
If you are using categories in your configuration you must specify at least two things (the category ID and the data set ID you want to plot by default). Say for example you have organized your data into the following categories:
<category name="by Discipline (Atmosphere, Ocean, Surface Marine, Land Surface, Topography, Bathymetry)">
 <category name="Atmosphere">
 <category ID="COADS-MON-CLIMO-ID" name="COADS monthly climatology" doc="http://ferret.wrc.noaa.gov/LAS_docFiles/coads_climatology.html">
 <filter action="apply-dataset" equals="COADS monthly climatology"/>
 </category>
 </category>
</category>

...

 <COADS-climatology
 name="COADS monthly climatology"
 url="file:coads_climatology"
 doc="http://www.ferret.noaa.gov/LAS_docFiles/coads_climatology.html">
...
In this case, you must tell LAS the category that contains the data set you wish to use. You are not required to assign an ID to an LAS category, but if you want to use it for the default plot go ahead and assign one in you configuration as we have done in this example by assigning the category ID="COADS-MON-CLIMO-ID". The data set itself has an opening tag <COADS-climatology which is what will become the data set ID for this data set. These are the two pieces of configuration you need.
<!-- Set at least the default category and dataset. -->
  <default_catid>COADS-MON-CLIMO-ID</default_catid>
 <default_dsid>COADS-climatology</default_dsid>
If you are not using categories, you must specify at least one thing (the dsid of the data set you want plot by default).
<default_dsid>ocean_atlas_subset</default_dsid>
N.B. If you only specify a category, data set and variable then LAS will try to create an XY plot of the data set. If the data are not defined in X and Y or if you want to plot a different cross section by default you must then specify three additional pieces of information: the operation id, the options id and dimension abbreviations of axes of the cross section you want plot.
You can look at the default configuration near the top of the las.xml file to get an idea of how to configure in a default for your own data sets.
The las.xml file with a default data set configured.
<lasdata>

 <output_dir>/home/users/rhs/tomcat/webapps/las/output</output_dir>
 <institution name="Pacific Marine Environmental Lab"
 contact="Roland.Schweitzer@noaa.gov"
 url="http://www.pmel.noaa.gov"/>

 <!-- Default properties for this server -->
 <properties>

 <product_server>
 <ui_timeout>20</ui_timeout>
 <ps_timeout>3600</ps_timeout>
 <use_cache>true</use_cache>
 <!-- Set at least the default dataset. -->
  <default_catid>ocean_atlas_subset</default_catid>
 <default_dsid>ocean_atlas_subset</default_dsid>
 <!-- You can also set the variable and plot you want to show initially. ->
 <default_varid>TEMP-ocean_atlas_subset</default_varid>
 <default_operation>Plot_2D_XY_zoom</default_operation>
 <default_option>Options_2D_image_contour_xy_7</default_option>
 <default_view>xy</default_view>
 </product_server>
The v7 UI
For this beta release, the old V7 user interface can be accessed at: http://www.yourwebserver/yourlaswebapppath/getUI7.do
Known Issues
- A bug in the NetCDF library that returns data from OPeNDAP data sets means that for some requests we will see an error. This may happen in animations where we are asking for data at the end of the time range, and for some Hofmuller plots such as XT or YT plots when the data has many time steps and we ask for a large range in time. The Ferret scripts in these cases make a request for sub-sampled data in order to speed up the requested result, and these sub-sampled, or strided, requests may return an error from the NetCDF library. The bug has been reported to the NetCDF developers at Unidata and they are working on a solution which should be available to us before the full LAS version 8.0 release.
- If you click the "Print" button in the top bar of LAS, the resulting print window is not scrollable in Internet Explorer 9 (works in Chrome, Firefox, and Safari). We plan to fix this as well as providing users more printing layout options.
- If a users adds a variable to a plot, but then hits the "X" button to delete it, the "Update Plot" button turns red even though there effectively is no change.
- In a comparison mode: If an update for a plot is taking a long time and a user hits the Cancel button, the update form becomes very large and pushes the other compare objects off the page.
- In comparing 2 plots mode: Changing the right-hand plot's longitude results in no change or an incorrect change.